Hello all,
Yesterday, we were testing for the second time the previous top with that chart :

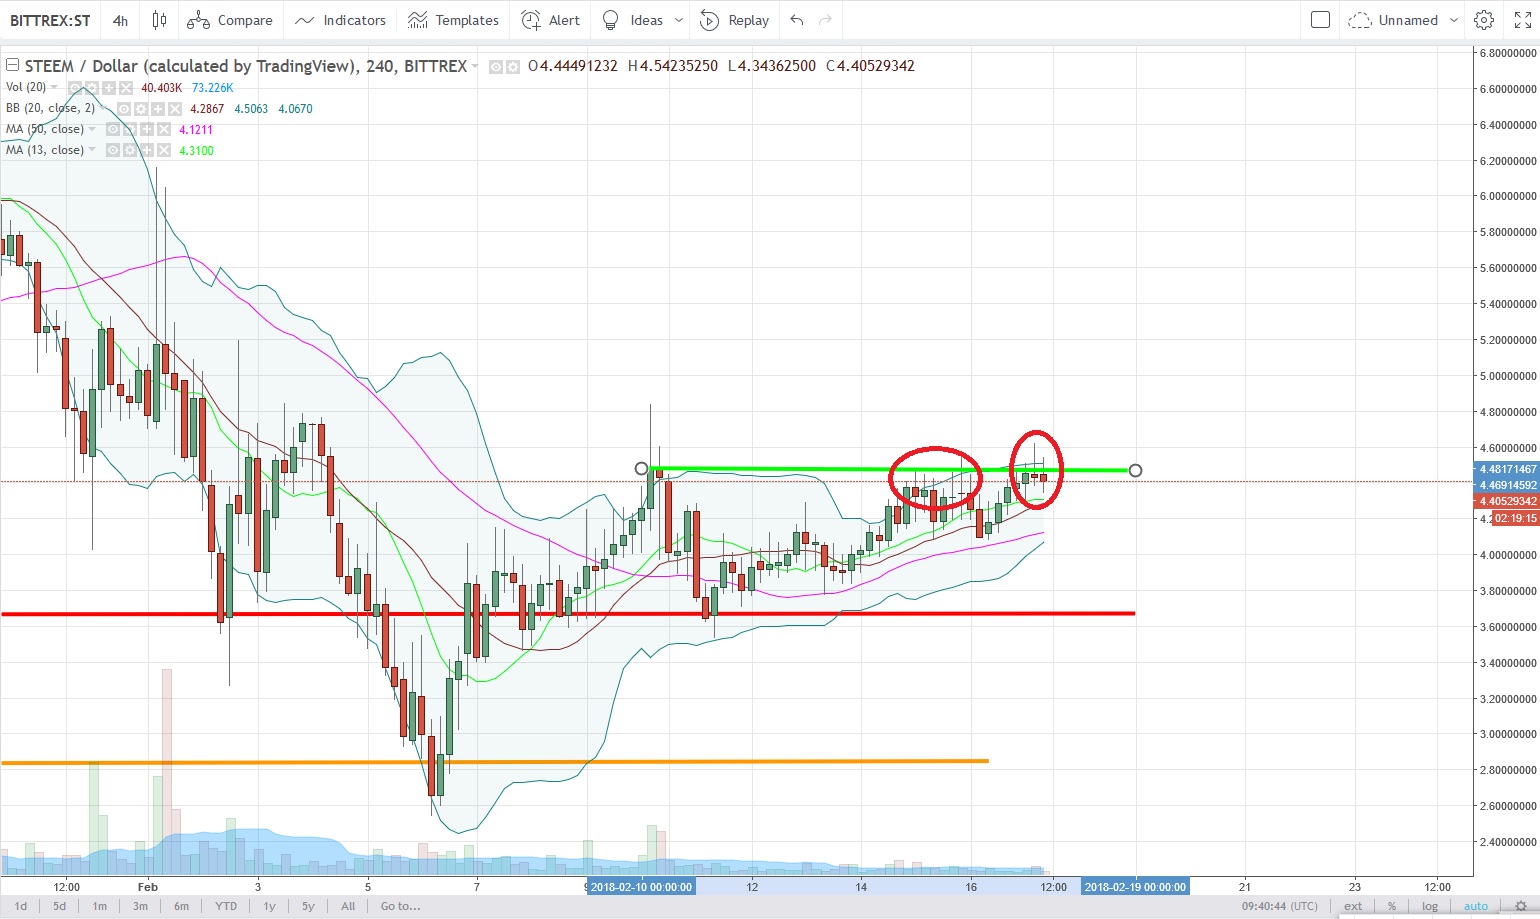
Here is the current chart :

As you can see, we failed again to break it and we have now a little correction.
We are in the middle of our 2 lines and we can see a DOJI in formation (green circle). For the new followers, the DOJI is often an indicator of change of direction or an indicator of indecision. So we could see happening a third attempt to break that resistance line in green but there are also probabilities that we go back on our support line in red. I will wait to see the result of that DOJI to adapt my positions.
I wish you massive profits,
Cryptopassion.io
Disclaimer : Never invest more than what you can afford to lose. This post is my personal opinion, do your own research before making any investment decisions. If you make any trades after reading this post, it is completely in your responsibility. I am not responsible for any of your losses. By reading this post you acknowledge and accept that.

As a trader, I recommend you the trading platform Bitfinex
10% discount on your trading fees for 1 month via this link !

With my daily exchanges of cryptos, I can recommend you the platform Binance


I knew the market was gunna have a correction, I sold bitcoin at 11100 and got back in at 10450! I love charts :)))
Downvoting a post can decrease pending rewards and make it less visible. Common reasons:
Submit
nice shot ! I tryed to make the same move but sold too early :l small losses happens :D
Downvoting a post can decrease pending rewards and make it less visible. Common reasons:
Submit
Maybe I have good statistic charts for you that helps also for investing in Steem.
https://steemit.com/steemit/@sevenseals/steem-statistic-charts-week-07-including-country-statistics
Downvoting a post can decrease pending rewards and make it less visible. Common reasons:
Submit
So if it tests resistance multiple times is that a good or a bad sign?
Downvoting a post can decrease pending rewards and make it less visible. Common reasons:
Submit
Depends where you started holding $. More time tests resistence more likely to go through with high enough volume of buyers...imo
Downvoting a post can decrease pending rewards and make it less visible. Common reasons:
Submit
Thanks @cryptopassion for the market analysis, it's always helpful and can be depend on.
Downvoting a post can decrease pending rewards and make it less visible. Common reasons:
Submit
Very great post sir.I am just waiting your next post sir.Thank you all the best.
Downvoting a post can decrease pending rewards and make it less visible. Common reasons:
Submit
@cryptopassion anytime bitcoin is rising or falling, other altcoin like steem tends to decrease.
I think that the reason.
Thanks for sharing.
Downvoting a post can decrease pending rewards and make it less visible. Common reasons:
Submit
Not all altcoins falls inverserly with bitcoin....Steem for e.g does not always...a few time it may.
Downvoting a post can decrease pending rewards and make it less visible. Common reasons:
Submit
Hey @cryptopassion, doesn't this like a head and shoulder pattern on the way ?
Downvoting a post can decrease pending rewards and make it less visible. Common reasons:
Submit
information I am most waiting for, thank you
Downvoting a post can decrease pending rewards and make it less visible. Common reasons:
Submit
Thanks dear sharing about the cyptocurrancy grap.
Downvoting a post can decrease pending rewards and make it less visible. Common reasons:
Submit
I too urge crypto currency investors to mind this time.
It's better you invest responsibly. Once your dime is lost, you'll cry for nobody. Hehee
Downvoting a post can decrease pending rewards and make it less visible. Common reasons:
Submit
Hi @cryptopassion, cool post 😉 me personally, i would love to see the price at 3.0 (the black level at the chart). that will be my entry level. Good Trades everybody and a nice sunday 😊
Downvoting a post can decrease pending rewards and make it less visible. Common reasons:
Submit
Why do you want to purchase at $3? Steem going down that far again? Steem would have to break through 4 supports....going to take may bears....imo
Downvoting a post can decrease pending rewards and make it less visible. Common reasons:
Submit
hi @hanamana 😊 always depends on "which side you´re looking at". I see the supports, but i also can see, that exact at these levels some stops are resting . little meal for the sharks 😉 have a nice sunday
Downvoting a post can decrease pending rewards and make it less visible. Common reasons:
Submit
okay, I see that...depends on which side of the fence you are on.
Downvoting a post can decrease pending rewards and make it less visible. Common reasons:
Submit
I think it is not the perfect time to invest.
lets wait for the DOJI report. 👐🏼
Downvoting a post can decrease pending rewards and make it less visible. Common reasons:
Submit
Thanks @cryptopassion for the market analysis, it's always helpful and can be depend on.
Downvoting a post can decrease pending rewards and make it less visible. Common reasons:
Submit
Steem dont fail nothing.
Btc rise thats why steem decrease 👍
Downvoting a post can decrease pending rewards and make it less visible. Common reasons:
Submit
Not always...usually not always effected inverserly by BTC movement.
Downvoting a post can decrease pending rewards and make it less visible. Common reasons:
Submit
Slow and steady wins the race, build up is good. :)
Downvoting a post can decrease pending rewards and make it less visible. Common reasons:
Submit