Hello everyone, some of you may know me by my nickname OZmaster,
well I opened this account in order to post Technical Analysis and decided to start of with #STEEM, seems appropriate ;)
So let's begin,
The following are charts from the Bittrex exchange,as it has the longest history i decided to take that one, after each chart(picture) will come a comment with explanation. Before each chart I will make a "legend" with the goal of the community having it easier to understand.
Legend
(LGDL)Light green dashed lines - "old" high's which should act as support
(LBDL)Light blue dashed lines - "recent" high's which should act as support
(PDL)Purple dashed lines - "recent" low's which should act as resistance
(PYL)Pointy yellow line -bottom part of recently broken triangle border
(YL)Yellow lines - "current" holding triangle borders
(RL)Red line - All Time High (ATH)
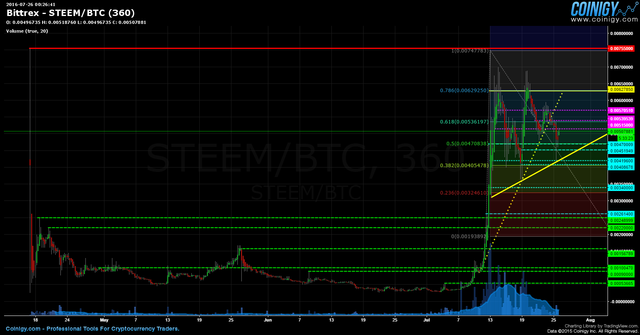
So here we have the full history of STEEM/BTC, first I want you to get an overview of the whole chart as well as the areas I will talk about.
As you can see i marked some tops/highs from before Jul(LGDL), those are "old" support lines(rather zones around those prices) where there is buy support to be expected on the order book, however those are "old" high's, high's which were made before the big pump accured.
A little bit above and to the right of the LGDL u can see the LBDL , those are the "recent" high's, the ones that are important for the trading range we are in right now.
Above the LBDL you can see the PLD, those are "recent" low's, the resistance lines in the trading range atm, around those lines the price has a higher chance of repelling back down.
PYL is the recently broken border of the triangle which resulted in the price going downwards as seen on picture.
YL are the border lines of the current triangle, meaning the price is expected to respect those lines and bounce of from them, breaking up or down with a hard move towards the end.
The RD is the All Time High line, at this point this is the highest and strongest resistance point ever reached by STEEM.
I'm gonna leave the LGDL and the time before July 10th for later and focus on the current situation, but will shortly get back to them later.
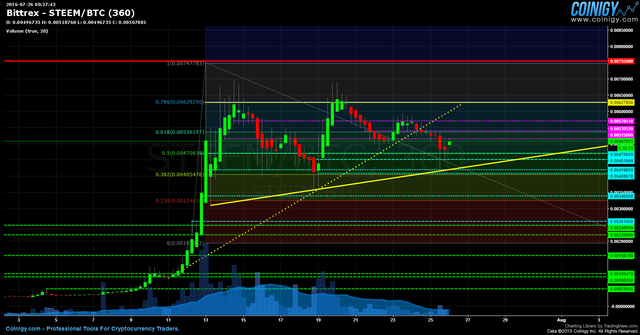
Now let's take a closer look to the time period from July 10th onward. Below you will see 2 identical charts, one with 6 hour candle's and one with 4 hour candle's, starting off with the 6 hour one.
(6h chart)
(4h chart)
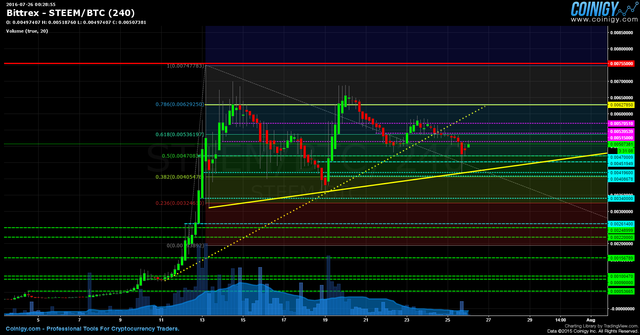
There is nothing much to comment no those chart's, just analyze them for a few minutes,get a feeling of where we are at in the market right now, you will see how the price "respects" the YL triangle borders, those are the "main" one so to say, using the other lines to slowly direct the trend.
In the coming 2 pictures I will explain the bullish as well as the bearish scenario
1.) Bullish scenario
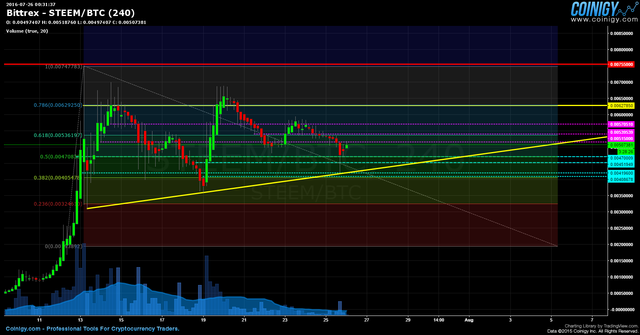
As you can see I deleted the LGDL and one (last/lowest) LBDL, raeson being is that I am going to explain the bullish scenario, aka the price going up.
The price keeps trading between the 2 YL borders, refusing to break down, using the LBDL's and later possibly also the PDL's as support points.
Slowly progressing upwards the price will tackle the upper YL border, if there is a successful break, we can expect and immediate attack on the RD All Time High (as there is no significant historical resistance nor support in between), most likely breaking it, making a new ATH, and setting a new floor on the top YL border.
2) Bearish scenario
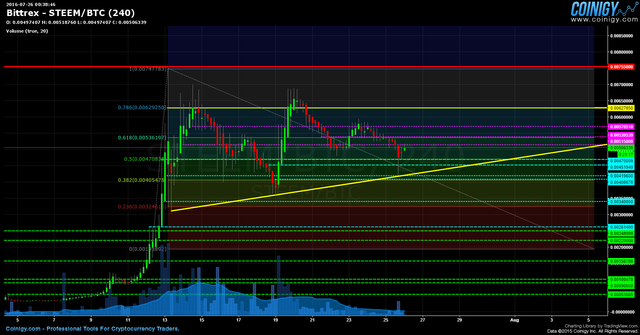
The price breaks the bottom YL borderline and makes a new low at around ~0.034 LBDL, IF the mentioned LBDL doesn't hold the price is likely to break down towards the last LBDL and even down into the LGDL, as the price pump after July 11th was hard and the price was climbing hard without backing down there is no strong support level in between the 0.0034 LBDL and the 0.0015 LGDL.
BONUS CHART
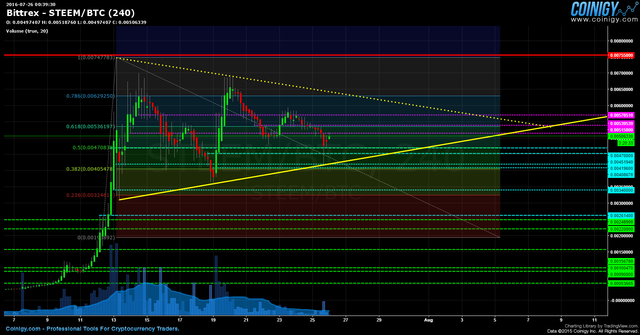
another possible form of the triangle, indicating the possibility that the price will trade towards the end of that triangle before making a decision of going up or down.
BONUS COMMENT
$STEEM is somewhat special, and therefor accurate predicting of it's price going up or down sharply in the near future is quite hard, the reason of all that being the business model behind the whole platform, STEEM, SBD and STEEM POWER. If the business model is good it can totally ignore every law of TA. I will write a whole post on that matter in the near future!
If anyone has any questions or need's help fell free to ask, I will try to explain as fast and as best as I can.
Critics, comments, reply's, counters, advice's, etc,,, are always welcome!
Have my charts helped you in any way?
Are there more people who are doing TA?
Disclaimer I am showing multiple scenario's on the price movement, in the post it'self I do not take any stance, either bullish or bearish. I am not responsible for either you're winning nor you're losses upon trading!
Kind Regards, OZ :)
you got some mad charting skills bro! why aren't you posting these daily for us? please start.
Downvoting a post can decrease pending rewards and make it less visible. Common reasons:
Submit
Thanks alot for the compliment, I will defo try and do my best to keep this up on a daily basis :)
Downvoting a post can decrease pending rewards and make it less visible. Common reasons:
Submit
Since you invite critics :)
Sorry but technical analysis isn't quantitative.
What you're experiencing is apophenia.
Price analysis makes absolutely zero sense if not based on a positive ev strategy (e.g. using normal distribution models, like market-makers do).
Moreover, I would add that price analysis also makes absolutely no sense if the orderbook isn't taken into consideration or perhaps even if you don't singly consider the orderbook.
Spoofing isn't illegal in crypto-markets, try placing an order at a particular trough and and see if it gets filled.
Thanks for your contribution though, nice to see some traders...
Downvoting a post can decrease pending rewards and make it less visible. Common reasons:
Submit
It's little more than reading the tea.
Downvoting a post can decrease pending rewards and make it less visible. Common reasons:
Submit
To add on that, this kind of analysis are useless (if not dangerous) do most investors. Regular people must focus on value and not price. If speculating on short term price variations, most people will, most likely, lose money.
Downvoting a post can decrease pending rewards and make it less visible. Common reasons:
Submit
Yep. Best investment advice I've heard on this.
Downvoting a post can decrease pending rewards and make it less visible. Common reasons:
Submit
Then Regular people should run from crypto. We have yet to see solid value in this entire industry.
Downvoting a post can decrease pending rewards and make it less visible. Common reasons:
Submit
In some cases, yes. Although, there is value in the inovation, in the ease of trading and value transfer, value in governance and value in usability.
This makes it woth it for the regular (non financial) person to invest some money on it. Risk control will bo on how much and on which coins.
There is always some speculation in any investment, BUT, investing is different from speculating.
Downvoting a post can decrease pending rewards and make it less visible. Common reasons:
Submit
why?
Downvoting a post can decrease pending rewards and make it less visible. Common reasons:
Submit
Apart from the risk factor that can vary on the nature of the investment, I would say that speculation is gangling on the price variations of an asset, investing is accumulation of capital on a asset based on its underling value (even if it is more or less intangible).
In speculation what matters the most is price, in investing what matter the most is value.
Downvoting a post can decrease pending rewards and make it less visible. Common reasons:
Submit
i love the bullis reindeer man
Downvoting a post can decrease pending rewards and make it less visible. Common reasons:
Submit
Hey! I drew my own chart, I wonder if you'd like to give me some feedback?
Here's the link! Enjoy!
Downvoting a post can decrease pending rewards and make it less visible. Common reasons:
Submit
Thank you for your very interesting analysis! I'm not much of a technical trader, but I love seeing it explained clearly as you have done, so thank you.
We just placed a trade based on the spread between Steem/USD and Steem/Steem$ and we expect to earn roughly $37.82 as a result. Here's the post if you're interested:
https://steemit.com/money/@trending/case-study-how-to-trade-market-distortions-to-profit-with-steem-and-bitcoin-i-put-my-money-where-my-mouth-is
Downvoting a post can decrease pending rewards and make it less visible. Common reasons:
Submit
Good job man.
Downvoting a post can decrease pending rewards and make it less visible. Common reasons:
Submit
Nice post and thanks for info. But u can give info about sites with trade Steem coins?
Downvoting a post can decrease pending rewards and make it less visible. Common reasons:
Submit
Agreed @the.whale this is an amazing post. @ozchartart all of this omnipresent transparent information about the world of Steem gives users that want to be involved the feedback they need. I have told everyone I know about Steem emphasizing the need for original content and the notion of an online community forum that will show so much insight into media markets and 2016 economics. I am so excited about the future and look forward to seeing how the return of students and the cooling temperatures effect user involvement.
Thanks so much. I am grateful and gladly upvote.
H
Downvoting a post can decrease pending rewards and make it less visible. Common reasons:
Submit
Thank you for this constructive comment, I can agree with you on many things :) there are many aspects of steem that yet have to be tested, but so far it is rly not looking bad :)
Downvoting a post can decrease pending rewards and make it less visible. Common reasons:
Submit
Technical Analysis Waves.

Downvoting a post can decrease pending rewards and make it less visible. Common reasons:
Submit
haha! Isn't that a semi-bullish head and shoulders continuum? If I ever saw a stronger buy signal...
Downvoting a post can decrease pending rewards and make it less visible. Common reasons:
Submit
now thats what i call a breakout xD
Downvoting a post can decrease pending rewards and make it less visible. Common reasons:
Submit
Definitely. I agree with you fully.
A daily update would be great. And I'm sure you'll benefit lots from it as well.
Downvoting a post can decrease pending rewards and make it less visible. Common reasons:
Submit
Will give my best to start it a keep it running :)
Downvoting a post can decrease pending rewards and make it less visible. Common reasons:
Submit
Yes this was quite good made. A realy well done jobb :)

The analys i dont know was cool. Couse i only use Bittrex and Coinmarcetkap to see buy sells and prise chart.
I hope for more analyze like this @ozchartart ;)
Keep up the good work, i would gladly vote this :)
Downvoting a post can decrease pending rewards and make it less visible. Common reasons:
Submit
um where is the uncensored version...
Downvoting a post can decrease pending rewards and make it less visible. Common reasons:
Submit
Yeah these charts are bad@
Thanks for the update, and I agree with @the.whale a daily or even weekly post like this would bring me and I'm sure MANY other people back to your page consistently :D
Downvoting a post can decrease pending rewards and make it less visible. Common reasons:
Submit
https://steemit.com/steemit/@minion/youtube-vs-steemit-enemies-or-siblings
[IMPORTANT] This post covers the Similarity between YouTube and Steemit as well on How to use Steemit and It's OFFICIAL CONTENT RULES.
Downvoting a post can decrease pending rewards and make it less visible. Common reasons:
Submit
Yes, please do @ozmaster. This puts everything in perspective. Looking forward to your post on why STEEM might be untouchable by the laws of technical analysis.
Downvoting a post can decrease pending rewards and make it less visible. Common reasons:
Submit
Great stuff, and incredibly useful. This is what we need!
Downvoting a post can decrease pending rewards and make it less visible. Common reasons:
Submit
the reason that rise and fall is unknown?
Downvoting a post can decrease pending rewards and make it less visible. Common reasons:
Submit
thanks guys..
own share trading knowledge
the possibility of a sideway direction, looking for the point of purchase and then climbed to trend up
because it has been a breakout from the initial position
Downvoting a post can decrease pending rewards and make it less visible. Common reasons:
Submit
Technical analysis doesn't mean anything though.
Downvoting a post can decrease pending rewards and make it less visible. Common reasons:
Submit
Great TA, next time you should commit to a bull or bear scenario.. Keep these coming
Downvoting a post can decrease pending rewards and make it less visible. Common reasons:
Submit
Tnx silver! I think i will keep my personal stance/ opinion for a separate section at the end or even better the comments :)
Downvoting a post can decrease pending rewards and make it less visible. Common reasons:
Submit
I was wondering the same thing. Do you think one scenario is more or less likely to occur? What factors do you think will play into which direction it goes?
Downvoting a post can decrease pending rewards and make it less visible. Common reasons:
Submit
To be honest i cannot rly lean towards any scenario, the reason beeing that the business model of steemit influences the market so much, another beeing that the technology , the platform, aswell as the business model are still in "beta". As mentioned in my post i will make a whole separate post on that matter in the near future! Thank you for asking!
Downvoting a post can decrease pending rewards and make it less visible. Common reasons:
Submit
good work as always!
Downvoting a post can decrease pending rewards and make it less visible. Common reasons:
Submit
I concur :)
Downvoting a post can decrease pending rewards and make it less visible. Common reasons:
Submit
Excellent analysis. Good luck to you
Downvoting a post can decrease pending rewards and make it less visible. Common reasons:
Submit
Thank you and thank you, if you are looking for more, be sure to check more often into the @ozchartart blog :)
Downvoting a post can decrease pending rewards and make it less visible. Common reasons:
Submit
This is good stuff. I'll be following.
Downvoting a post can decrease pending rewards and make it less visible. Common reasons:
Submit
Thank's, I'll make sure i keep'em coming
Downvoting a post can decrease pending rewards and make it less visible. Common reasons:
Submit
nice post!
Excellent analysis ,thank you @ozchartart
Downvoting a post can decrease pending rewards and make it less visible. Common reasons:
Submit
Thanks, no problems! will do my best to deliver good charts to you guys WITH explanation and help if needed!
Downvoting a post can decrease pending rewards and make it less visible. Common reasons:
Submit
Hi @ozmaster you the best
Downvoting a post can decrease pending rewards and make it less visible. Common reasons:
Submit
wow cool men,
Downvoting a post can decrease pending rewards and make it less visible. Common reasons:
Submit
An upward trend is a good trend.
Downvoting a post can decrease pending rewards and make it less visible. Common reasons:
Submit
I rly hope it for steem
Downvoting a post can decrease pending rewards and make it less visible. Common reasons:
Submit
Really appreciate you putting this together since I'm very new to trading crypto. I have some basic understandings of trading, but these chart lines help immensely for getting insight into how the market could behave.
There's a hardfork tomorrow that will remove the liquidity rewards that some whales have used as an "exploit" to gain 1200 STEEM daily. Due to the removal of these rewards (until a better system can be implemented) @jl777 was predicting the price could double after Tuesday. So, I'm betting that STEEM hits ATH by Friday. Well, one can hope anyway :)
Someone suggested you post these daily, but that might get to be a bit of work. It'd be nice to at least get this weekly, or monthly. I'm sure it'll be worth the effort!
Downvoting a post can decrease pending rewards and make it less visible. Common reasons:
Submit
to be honest I don't mind posting charts on a daily basis as i enjoy making them, those the name for the account "@ozchartart" ;)
If you happen to have any questions regarding understanding or terms feel free to ask, I know on the beggining it can be rly hard to keep up with everything.
Regards, OZ
Downvoting a post can decrease pending rewards and make it less visible. Common reasons:
Submit
Well done with the TA, as always. Bookmarking your nickname page so I can continuously refer to you charts and explanations as needed.
Downvoting a post can decrease pending rewards and make it less visible. Common reasons:
Submit
Thank you my friend! If any kind of question pops to ur mind feel free to ping me!
Downvoting a post can decrease pending rewards and make it less visible. Common reasons:
Submit
You know I will!
Downvoting a post can decrease pending rewards and make it less visible. Common reasons:
Submit
Good analysis, Oz!
If it's about SBD would it differ much?
Downvoting a post can decrease pending rewards and make it less visible. Common reasons:
Submit
Did'nt realy do a STEEM/SBD chart yet, it's quite a good idea to make one! thanks!
Downvoting a post can decrease pending rewards and make it less visible. Common reasons:
Submit
OZ, IMO your charts are a little messy for my liking, with the numerous lines of support and all retracements, however for using multiple timeframes and NOT using 'garbage' indicators (MACD, Stoch's, Momentum, etc) I commend you and upvote you.
Also, your first chart made me see that STEEM is likely doing an ascending triangle pattern with 0.0068 as the primary resistance/breakout point and with today's low, 0.004'ish, as the likely 'must hold' support line.
More often than not the ascending triangle is bullish continuation pattern and it results in much higher prices.
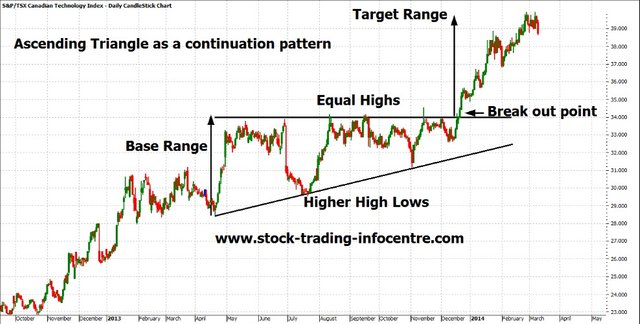

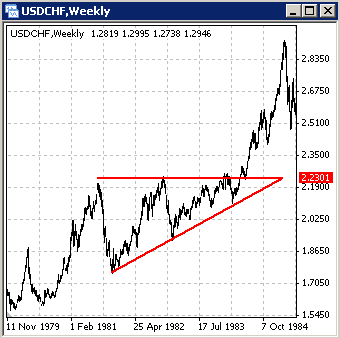
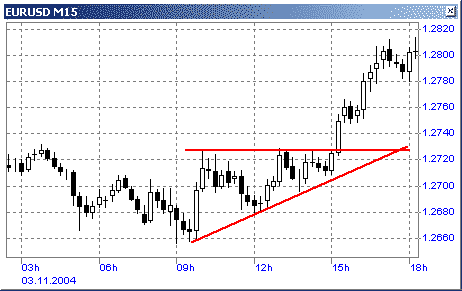
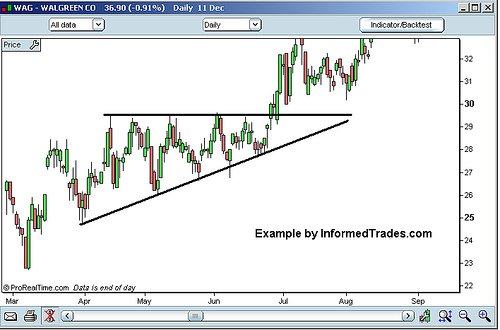
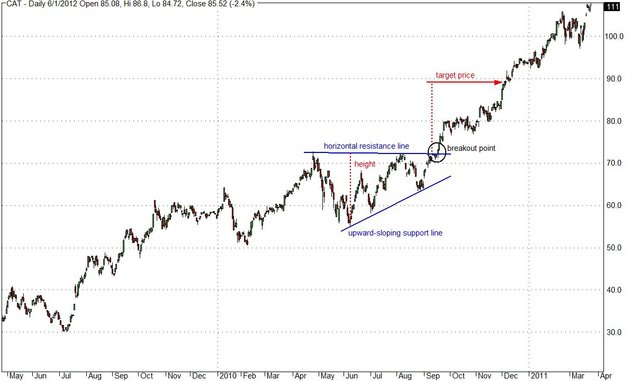
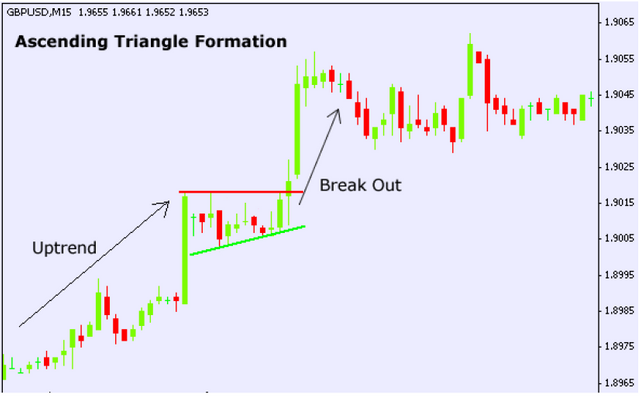
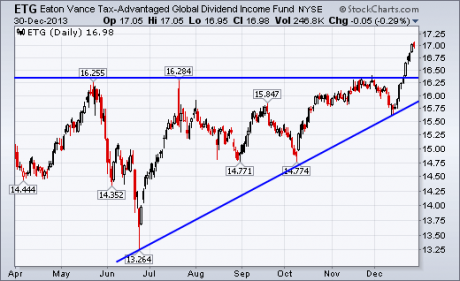
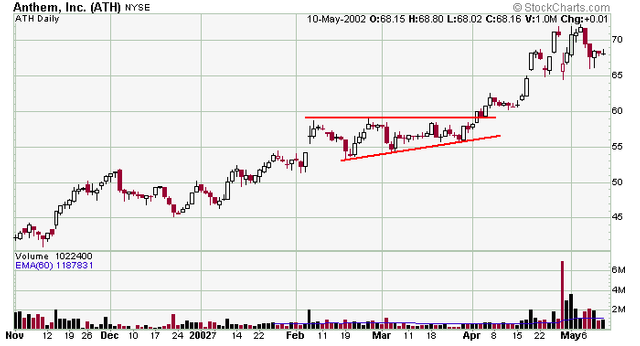
I've collected a handful of good example charts across multiple asset classes here from the vast interwebs showing ascending triangle formations breaking out. IMO STEEM is quite bullish here....
Downvoting a post can decrease pending rewards and make it less visible. Common reasons:
Submit
nice market
Downvoting a post can decrease pending rewards and make it less visible. Common reasons:
Submit
Good !

Downvoting a post can decrease pending rewards and make it less visible. Common reasons:
Submit
candlestick pattern
Investors can also psychological
take a moment
we see the future :)
Downvoting a post can decrease pending rewards and make it less visible. Common reasons:
Submit
I agreee they are messy I defo agree there:) but i will work on my charting skills, that is the goal :) to gett better as time goes by :)
My charting is nowhere near of being what I want it to be ;)
Thanks for the critics! alot!
Downvoting a post can decrease pending rewards and make it less visible. Common reasons:
Submit
Sweet chart skills. Glad to see people using Coinigy as well, I love it so far. It has a great UI and being able to trade and use all of the tools they have can't be beat.
Downvoting a post can decrease pending rewards and make it less visible. Common reasons:
Submit
Thanks :) so far for the altcoin market i prefer coinigy aswell :)
Downvoting a post can decrease pending rewards and make it less visible. Common reasons:
Submit
Finally someone posting TA worth hitting the follow button for.
Downvoting a post can decrease pending rewards and make it less visible. Common reasons:
Submit
Thank you very much! I will keep the charts going!
Downvoting a post can decrease pending rewards and make it less visible. Common reasons:
Submit
!moooooooon
Downvoting a post can decrease pending rewards and make it less visible. Common reasons:
Submit
lets hope we take ETH's spot:)
Downvoting a post can decrease pending rewards and make it less visible. Common reasons:
Submit
I think were going to see some ridiculous increase coming up here soon as the goddamn market maker (faker) rewards are cut. Shit is bout to get realz.
Downvoting a post can decrease pending rewards and make it less visible. Common reasons:
Submit
I agree. But I don't think that most of those rewards are going on the market.
Downvoting a post can decrease pending rewards and make it less visible. Common reasons:
Submit
That is the main question,if most are beeing dumped the buisness model is proving very stable
Downvoting a post can decrease pending rewards and make it less visible. Common reasons:
Submit
"If anyone has any questions or need's help fell free to ask, I will try to explain as fast and as best as I can. Critics, comments, reply's, counters, advice's, etc,,, are always welcome!"
I'm not really a fan of TA, but I do believe there are points that are "oversold" and "overbought"... and these would have to be charted - so, in a sense, I do have my own "version" of TA.
However, having said that, I cannot seperate TA from Fundamental analysis. I mean that particular chart is heavily affected by things like the start of Poloniex trading, which is a "one-off" event, unlike the more long-term liquidation of STEEM (which is a given and absorbs more $$$ from the market for a given quantity, the higher the price is).
I also question how can TA (alone) factor for fundamental differences in cryptocurrencies - say one has 0% inflation, another has 30% inflation. Yet you see two charts and you are trying to analyse their daily movements without any regard for that fact. Although it is very possible that this type of analysis lead to market activity which makes it a self-fulfilling prophecy. Anyway, I'm just ranting my long-term views of TA...
Downvoting a post can decrease pending rewards and make it less visible. Common reasons:
Submit
I agree, as mentioned in the post, STEEM is about much more then just TA.
Downvoting a post can decrease pending rewards and make it less visible. Common reasons:
Submit
As someone who has spent their entire career in finance, I am extremely skeptical of technical analysis. There is no empirical evidence that anyone can accurately predict trends - charting, fibonacci, bollinger bands, etc. are all voodoo. Invest in this platform because you think its a neat social experiment that could help incentivize a top-notch community of content, not because some charts tell you what you want to believe.
Thanks for the post though - the content is getting better than just a bunch of chicks with big boobs baking cakes because of the efforts people like you are putting in to this thing. The next step is to have an analysis done without voodoo :)
Downvoting a post can decrease pending rewards and make it less visible. Common reasons:
Submit
I agree with you, invest in something you understand and believe in, but then again I love charting :)
Downvoting a post can decrease pending rewards and make it less visible. Common reasons:
Submit
I use charting all the time and I really like how you have made so many reference lines. It helps me look for support zones.
What's pretty amazing is how steem has jumped very high but maintained so much support since. The only coins that I've ever seen do anything like this are ethereum and factom.
What do you think of @dashpaymag's analysis at https://steemd.com/steem/@dashpaymag/price-analysis-steem-bull-flag-how-high-will-it-go ? I think we are looking at a real bull flag. I'd like to know your thoughts.
Downvoting a post can decrease pending rewards and make it less visible. Common reasons:
Submit
Comment by donaldjohntrump. Upvoted by berniesanders. Gotta love the irony.
Downvoting a post can decrease pending rewards and make it less visible. Common reasons:
Submit
Can I play too if i promise not to make anymore antisemetic comments to the dnc
Downvoting a post can decrease pending rewards and make it less visible. Common reasons:
Submit
lol i'm feeling honored
Downvoting a post can decrease pending rewards and make it less visible. Common reasons:
Submit
I watched the vid yesterday, pretty well explained, time well spent indeed!
The thing with TA is we can never be 100% sure, because the price doesn't evolve only around the TA
Downvoting a post can decrease pending rewards and make it less visible. Common reasons:
Submit
@ozchartart @ozmaster, I have a suggestion...if you're willing...
Discuss your history of success and gains/losses by following the charting and TA you have previously completed.
If you have proven success in the past and are able to present everyone here with some details about that history, you not only could gain a whole lot more followers, but give everyone else a much better understanding of how and why you do the charting and TA the way you do it along with a phenomenal learning opportunity for everyone else.
I, for one, am very excited to learn more about how to properly read markets and make some predictions.
Downvoting a post can decrease pending rewards and make it less visible. Common reasons:
Submit
will do ;) I think I even have a fun and inovative idea;)
Downvoting a post can decrease pending rewards and make it less visible. Common reasons:
Submit
Easy to follow
Downvoting a post can decrease pending rewards and make it less visible. Common reasons:
Submit
Thanks! that means alot!
Downvoting a post can decrease pending rewards and make it less visible. Common reasons:
Submit
What, bro ....THANK YOU!
Downvoting a post can decrease pending rewards and make it less visible. Common reasons:
Submit
hehe no problem, always
Downvoting a post can decrease pending rewards and make it less visible. Common reasons:
Submit
Finally someone that uses price action and provides 'what if scenarios'. You've also accurately painted a picture of the context rather than just pick out a familiar looking pattern and using that as some kind of signal. We have very similar charting styles. I'm a big fan of horizontal lines and no indicators.
A couple of other things to take into account would be the buying and selling pressure due to arbitrage opportunities in the Steem Dollar and the implications of the removal of the liquidity rewards in the internal market.
Thanks for your analysis.
Downvoting a post can decrease pending rewards and make it less visible. Common reasons:
Submit
Thanks, indeed, I prefer doig what if scenarios and staying on the neutral in the post, show people the whole picture and letting them decide for themselves with hopefuly a better understanding after reading my post :)
Downvoting a post can decrease pending rewards and make it less visible. Common reasons:
Submit
The way it should be done, in my opinion, thanks @ozmaster ! Looking forward to it.
Downvoting a post can decrease pending rewards and make it less visible. Common reasons:
Submit
no problem at all :) I think everyone should know a bit of TA cos it helps understand the overall markets aswell on a large time scale
Downvoting a post can decrease pending rewards and make it less visible. Common reasons:
Submit
I love these charts and appreciate the work tha goes into them!
Downvoting a post can decrease pending rewards and make it less visible. Common reasons:
Submit
Thank you :) They are made with passion and love ;)
Downvoting a post can decrease pending rewards and make it less visible. Common reasons:
Submit
Very well done I wish my charting skills were half as good as yours. definitely keep them coming! :-)
Downvoting a post can decrease pending rewards and make it less visible. Common reasons:
Submit
Thank you very much for this egotriping comment! :)
Downvoting a post can decrease pending rewards and make it less visible. Common reasons:
Submit
Many possibilities here, and well calculated risk is a risk we can take. Well done!
Downvoting a post can decrease pending rewards and make it less visible. Common reasons:
Submit
Thank you:)
Downvoting a post can decrease pending rewards and make it less visible. Common reasons:
Submit
Downvoting a post can decrease pending rewards and make it less visible. Common reasons:
Submit
nice analysis @ozchartart keep it up!
Downvoting a post can decrease pending rewards and make it less visible. Common reasons:
Submit
Thank you very much gekko:)
Downvoting a post can decrease pending rewards and make it less visible. Common reasons:
Submit
It's raining steeeeem.Alelujaa. :) Great analysis
Downvoting a post can decrease pending rewards and make it less visible. Common reasons:
Submit
have u ever seen the raining man tattoo?
XD
Downvoting a post can decrease pending rewards and make it less visible. Common reasons:
Submit
Don't even know what to say. And if I don't say anything it would be strange.
Will leave it like that. And remove upvote for the respect of victims. RIP
Downvoting a post can decrease pending rewards and make it less visible. Common reasons:
Submit
sorry if u get offended by that, I didn't mean no harm, i think its a funny joke, no disrespect to the victims.... sry but don't plan to nor won't i change my humor, jokes are jokes:), but i respect ur stance!
Downvoting a post can decrease pending rewards and make it less visible. Common reasons:
Submit
...
Downvoting a post can decrease pending rewards and make it less visible. Common reasons:
Submit
P.s. if anyone has problems understanding something i'll gladly explain
Downvoting a post can decrease pending rewards and make it less visible. Common reasons:
Submit
Thanks for the chart and you explained it very well!
Downvoting a post can decrease pending rewards and make it less visible. Common reasons:
Submit
no problem :) i'm glad you find it easy to understand
Downvoting a post can decrease pending rewards and make it less visible. Common reasons:
Submit
Thank you for the explanations, I followed you!
Downvoting a post can decrease pending rewards and make it less visible. Common reasons:
Submit
Thank you for the folow, no problem :)
Downvoting a post can decrease pending rewards and make it less visible. Common reasons:
Submit
Interesting...
I posted 18hrs ago a very similar post (the similarities between multiple time frames and the disclaimer at the end are quite funny to say the least)
apparently I am lacking the "whale's blessings/connections"
take care
https://steemit.com/steem/@rd7783/steem-price-analysis-steem-btc-on-bittrex
Downvoting a post can decrease pending rewards and make it less visible. Common reasons:
Submit
dw I can provide slack notes with the same chart 1 and 3 days earlier, about disclaimer, did it on my DGB post aswell, nice chart thou, very tidy i like it!
Downvoting a post can decrease pending rewards and make it less visible. Common reasons:
Submit
alright Oz, I'm gonna let you off on this one ;)
thanks for the reply
Downvoting a post can decrease pending rewards and make it less visible. Common reasons:
Submit
no problem! always man, will follow you from now on, I wanna see others chart aswell!, I'm sure there are many more whome are far better at TA then myself! P.S. always put disclaimer , u never know who might have a bad day, and I doubt any of the bloggers wanna be responsible for someone's
Downvoting a post can decrease pending rewards and make it less visible. Common reasons:
Submit
I made a post about the problems I see using TA in the BTC/STEEM pair, partialy in response to this post, let me know what you think, I am still looking to be convinced by TA
https://steemit.com/steemit/@fiveboringgames/dangers-of-using-the-btc-steem-pair-for-technical-analysis
Downvoting a post can decrease pending rewards and make it less visible. Common reasons:
Submit
Thank's, replyied on ur post and gave u an upvoty :)
Downvoting a post can decrease pending rewards and make it less visible. Common reasons:
Submit
good analysis, in my opinion steem will go down to 400k level, i think it is his equilibrium price, i am really interested in see too if SBD can sustain the 1 usd level
Downvoting a post can decrease pending rewards and make it less visible. Common reasons:
Submit
That is one of the challenges, seeing SBD keeping its price
Downvoting a post can decrease pending rewards and make it less visible. Common reasons:
Submit
Amazing technique of fibonacci ! Master teach me how to set the fibo !
Downvoting a post can decrease pending rewards and make it less visible. Common reasons:
Submit
thanks , maybe i'll make a simple tutorial one day ;)
Downvoting a post can decrease pending rewards and make it less visible. Common reasons:
Submit
Great to hear that from you , follow you start from now on ! Thanks :)
Downvoting a post can decrease pending rewards and make it less visible. Common reasons:
Submit
Thank's for the follow, I'll give the fibo put alot of effort into making the fibo psot as easy to understand as possible
Downvoting a post can decrease pending rewards and make it less visible. Common reasons:
Submit
Thanks mate much appreciate .
Feel free to drop in my blog .
Downvoting a post can decrease pending rewards and make it less visible. Common reasons:
Submit
Excellent analysis. Good luck for you
Downvoting a post can decrease pending rewards and make it less visible. Common reasons:
Submit
Thank you very much
Downvoting a post can decrease pending rewards and make it less visible. Common reasons:
Submit
OK
Downvoting a post can decrease pending rewards and make it less visible. Common reasons:
Submit
Gday OZ, welcome to steemit - awesome first post I'll be following :)
I did my own TA post for BTCCNY on a longer timeframe here
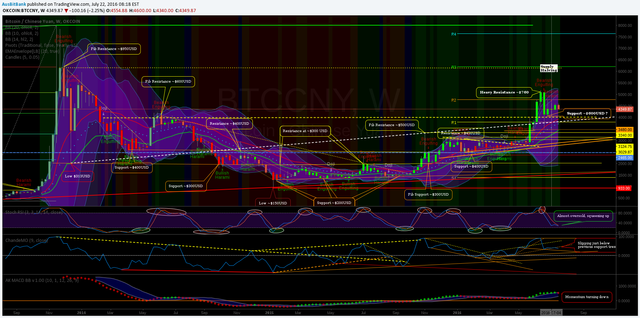
https://steemit.com/bitcoin/@ausbitbank/btccny-weekly-timeframe-analysis-and-nostalgia-for-22-7-2016
The post includes links for the full template for people to copy / modify for their own purposes.. I kinda like stepping into someone elses trading setup, will you consider doing these in the future ?
I'd be interested to know if you use any other indicators, or is this purely based on trendline support/resistance points + fibonacci/pivots ?
Downvoting a post can decrease pending rewards and make it less visible. Common reasons:
Submit
i'm looking into using as few indicators as possible tbh,, i actly wanna ask u how do i get that link where ppl can then go into the chart and change it themselves?
Tnx man, very nice post u did there!
Downvoting a post can decrease pending rewards and make it less visible. Common reasons:
Submit
To make your own just create a new chart in tradingview (need to be logged in), then in the top right corner dropdown give it a name and save it .. Copy your current url from address bar and it should just work for others - I believe they get to see future chart updates as well, as long as you use that same chart in tradingview.. Thx for the feedback :)
Downvoting a post can decrease pending rewards and make it less visible. Common reasons:
Submit
Thank you very much! this has been a mistery to be for a such loooong time! kudus!
no problemo :) Will always give my best to give good feedback aswell. Keep it up :)
Downvoting a post can decrease pending rewards and make it less visible. Common reasons:
Submit
Pleasure to help, I've been using tradingview far too long lol .. I'm @ausbitbank on there as well if you (or anyone!) wants to connect there too :)
Downvoting a post can decrease pending rewards and make it less visible. Common reasons:
Submit
good luck @ozchartart

Downvoting a post can decrease pending rewards and make it less visible. Common reasons:
Submit
thanks
Downvoting a post can decrease pending rewards and make it less visible. Common reasons:
Submit
Great work ozchartart. You're probably one of the great Steemers of our time ;)
Downvoting a post can decrease pending rewards and make it less visible. Common reasons:
Submit
hehe:) I hope I become one:)
Downvoting a post can decrease pending rewards and make it less visible. Common reasons:
Submit
You already are. No doubt.
Downvoting a post can decrease pending rewards and make it less visible. Common reasons:
Submit
Hey OZmaster, thanks for posting these and yes, I need to UP everyone on the daily part, if you could do it, you will have my constant upvote.
You have the chance here to be one of the first people that benefits from Steemit's main goal: Reach a stable income as an author of valuable content
I would have a question though:
Did @dantheman pull out 13k yesterday to have it in his pocked and buy the Steem back today in case it dips? It bent the value down by 10% when he sold the steem , why won't it bring it up the same today if the fork takes Steem south?
Thanks in advance and keep at it!
Downvoting a post can decrease pending rewards and make it less visible. Common reasons:
Submit
heh just read the fork updates, hmm well tbh idk, they are stoping the liquidity rewards for the time beeing that will sure cut some flow into the market and impact the price, as said the post is a pure TA, without looking into technology, updates or anything else, pure market TA.
it is possible that some whales are wanting to buy cheap coins, but why dan took out 13k yesterday, I rly wouldn't know.
Thanks alot for the comment :)
Downvoting a post can decrease pending rewards and make it less visible. Common reasons:
Submit
Thanks for the feedback! :)
Downvoting a post can decrease pending rewards and make it less visible. Common reasons:
Submit
my pleasure !
Downvoting a post can decrease pending rewards and make it less visible. Common reasons:
Submit
For me the big question is if SBD will be capable of sustain the 1$ price
Downvoting a post can decrease pending rewards and make it less visible. Common reasons:
Submit
That's another big test for the whole steemit project :), thats why I don't like making my positions based on TA only
Downvoting a post can decrease pending rewards and make it less visible. Common reasons:
Submit
Perhaps its a gross oversimplification, but can't one simply look at $steem as a hedge on regular steem. Since the $steem to steem conversion rate goes down as steem increases in price, wouldn't we expect them to move in opposition to one another?
Downvoting a post can decrease pending rewards and make it less visible. Common reasons:
Submit
one needs to take into account the depth of SBD on external exchanges
and on internal exchange and looking at this ratio
u might get some good arbitrage opportunity
Downvoting a post can decrease pending rewards and make it less visible. Common reasons:
Submit
there were some really good arbitrage opportunities when the ext. exchanges first listed SBD.... at this point though, there are so many market makers on all 3 exchanges bidding on the arbitrage that the window of opportunity seems to close fairly quickly when it happens.
Downvoting a post can decrease pending rewards and make it less visible. Common reasons:
Submit
Good work..
Downvoting a post can decrease pending rewards and make it less visible. Common reasons:
Submit
thanks :)
Downvoting a post can decrease pending rewards and make it less visible. Common reasons:
Submit
Downvoting a post can decrease pending rewards and make it less visible. Common reasons:
Submit
Hello and thank you very much :)
Downvoting a post can decrease pending rewards and make it less visible. Common reasons:
Submit
wow good
Downvoting a post can decrease pending rewards and make it less visible. Common reasons:
Submit
tnx alot :)
Downvoting a post can decrease pending rewards and make it less visible. Common reasons:
Submit
This is a good post
Downvoting a post can decrease pending rewards and make it less visible. Common reasons:
Submit
Tnx! hope u will like the coming ones as well!
Downvoting a post can decrease pending rewards and make it less visible. Common reasons:
Submit
Nice charts,
but keep it simple,
Downwaves in the wedge are corrective, upwaves impulsive -> wedge = consolidation.
I bet on breakout in upside direction.
Downvoting a post can decrease pending rewards and make it less visible. Common reasons:
Submit
Thank You, I will keep that in mind :)!
Downvoting a post can decrease pending rewards and make it less visible. Common reasons:
Submit
awesome dude
GBU for @ozchartart
@berniesanders for president
Downvoting a post can decrease pending rewards and make it less visible. Common reasons:
Submit
Hehehe Tnx:)
Downvoting a post can decrease pending rewards and make it less visible. Common reasons:
Submit
Only hope that he would upvote but he never gave me upvote,,, lol
Downvoting a post can decrease pending rewards and make it less visible. Common reasons:
Submit
I really like your analysis. Simple and easy to follow. Your interpretation of the charts makes sense and the best part is, you don't push one outcome over another since steem is so new and there are a lot of unknowns about it. I will be watching your posts closely for further trend analysis.
Downvoting a post can decrease pending rewards and make it less visible. Common reasons:
Submit
Thank you, yes i firmly believe steem has big tests infront of itself and a correct overview of the chart should stay neutral as far as positioning goes
Downvoting a post can decrease pending rewards and make it less visible. Common reasons:
Submit
Thats pretty cool analysis. I also checked RSI,MACD and Moving Average indicators based on bittrex charts.
I set RSI period to 15 and as you can see, the RSI indicator signaled oversold on the price of 0.0043 in the pic below :
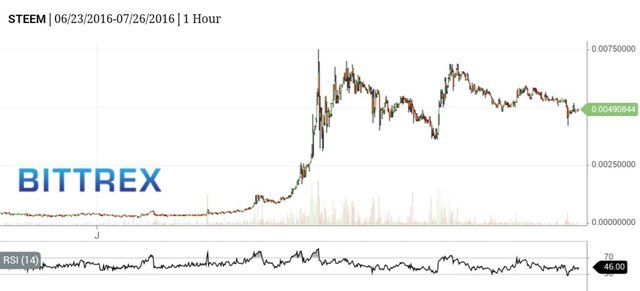
But MACD is still negative but it will heading up and cross the 0 line with a little price movement so still we can't talk with certainty about it.
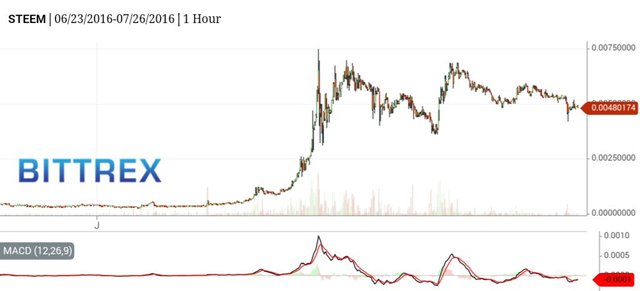
I myself have trust in moving average its so clear and most of the times it brings you profit. I tested it with bots and without bots so I can tell you this easy method for trading. So simple!
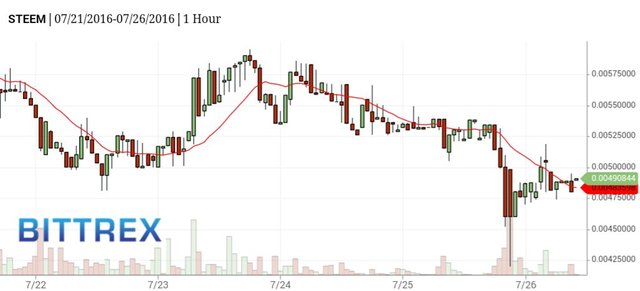
Just look at coin price, if it goes above MA by one candle buy it and if it goes below MA again by one candle sell it ! So easy, isn't it? :) but it works all the times and also works better on long term. You can try it yourself (for long time I suggest to use it for bitcoin trading).
So I checked it with STEEM and you can see the price crossed MA by one candle so it's time to buy :)
I hope this post help you as complementry to op.
Downvoting a post can decrease pending rewards and make it less visible. Common reasons:
Submit
Thanks for the addition and the well prepped comment!:) hope I see more from you!
Downvoting a post can decrease pending rewards and make it less visible. Common reasons:
Submit
Your welcome my friend :)
I'm one of steemers now and wish the best for it...
Downvoting a post can decrease pending rewards and make it less visible. Common reasons:
Submit
Great technical analysis @ozchartart
Downvoting a post can decrease pending rewards and make it less visible. Common reasons:
Submit
Thank you alot
Downvoting a post can decrease pending rewards and make it less visible. Common reasons:
Submit
i dont know about analysis wth indicator. so where price will go? up or down?
everything about whales?
Downvoting a post can decrease pending rewards and make it less visible. Common reasons:
Submit
I rly woldnt like calling the movement of price based just on the STEEM/BTC TA, I would still look for many more things before positioning myself ;)
Downvoting a post can decrease pending rewards and make it less visible. Common reasons:
Submit
Great Charts but I think Steem is such a new currency that it will take time to come up with resistance and support level , then only we will be able to monitor it better using technical analysis.
Downvoting a post can decrease pending rewards and make it less visible. Common reasons:
Submit
oh most definitly , steemit is still in the beta, so are the markets ;)
Downvoting a post can decrease pending rewards and make it less visible. Common reasons:
Submit
Follow buy.
Downvoting a post can decrease pending rewards and make it less visible. Common reasons:
Submit
cutie, nah just a TA :) upvote for the lil one
Downvoting a post can decrease pending rewards and make it less visible. Common reasons:
Submit
Analysis is very good! Thanks @ozchartart. Go on bro!!!
Downvoting a post can decrease pending rewards and make it less visible. Common reasons:
Submit
Thanks alot for ur support :)
Downvoting a post can decrease pending rewards and make it less visible. Common reasons:
Submit
Great technical analysis.
I have been trading since 5 years and got some experience with that. Only critcal point is in my opinion that the STEEM market is at this early point to illiquide and there is too less algorithm trading, so technical analysis is at this point to impercise. But with these growth rates you will have a great future here.
Downvoting a post can decrease pending rewards and make it less visible. Common reasons:
Submit
I totaly agree with you that its way to early to predict a certain future for steem atm,
Thanks for the comment and support!
Downvoting a post can decrease pending rewards and make it less visible. Common reasons:
Submit
Great post. You have professional technical analysis skills. Eager to read your coming posts.
Downvoting a post can decrease pending rewards and make it less visible. Common reasons:
Submit
Thanks alot!, well i hope there are a few worth reading :)
Downvoting a post can decrease pending rewards and make it less visible. Common reasons:
Submit
This is a very thorough write up. Great analysis, and well written. Now time will tell which direction it goes.
Downvoting a post can decrease pending rewards and make it less visible. Common reasons:
Submit
exactly, time will tell! very well said!
Downvoting a post can decrease pending rewards and make it less visible. Common reasons:
Submit
Well done, your analysis is spot on. Just what I was thinking too. My only question is how the 100% inflation rate comes into play here. I'm not sure myself. What do you think?
Downvoting a post can decrease pending rewards and make it less visible. Common reasons:
Submit
that highly depends on the userbase growth and the way most of the users look at steem, a future platform and means of payment, or as a quickbuck milkmachine
Downvoting a post can decrease pending rewards and make it less visible. Common reasons:
Submit
You're right. It's still early days, so kinda hard to predict which way Steemit will go.
Downvoting a post can decrease pending rewards and make it less visible. Common reasons:
Submit
Great charts man! It's so good I still don't understand anything. Guess I'm not a math guy :/
Downvoting a post can decrease pending rewards and make it less visible. Common reasons:
Submit
Tnx, maybe I can help u understand it better? It's not rly about math and numbers in the TA for me, rather art ;)
Downvoting a post can decrease pending rewards and make it less visible. Common reasons:
Submit
Thx. Please post TA for bitcoin and ethereum as well.
Downvoting a post can decrease pending rewards and make it less visible. Common reasons:
Submit
Will do u got my word :)
Downvoting a post can decrease pending rewards and make it less visible. Common reasons:
Submit
That's awesome! I wish I could read the charts as you do my friend....brilliant!
Downvoting a post can decrease pending rewards and make it less visible. Common reasons:
Submit
Thanks :)
Downvoting a post can decrease pending rewards and make it less visible. Common reasons:
Submit
Nice post with beautiful charts. Do you know a way to see these charts without needing to make an account in bittrex ? I mean, on Kraken you can open bitcoin/ethereum/litecoin charts like this without having an account on Kraken. I would love to be able to open these charts without making an account on bittrex.
Downvoting a post can decrease pending rewards and make it less visible. Common reasons:
Submit
Thank you! sure, there is https://www.tradingview.com/ as well as https://www.coinigy.com/ and https://cryptrader.com/
Downvoting a post can decrease pending rewards and make it less visible. Common reasons:
Submit
Thanks for the links !
Downvoting a post can decrease pending rewards and make it less visible. Common reasons:
Submit
hello The expertise of good friends
Downvoting a post can decrease pending rewards and make it less visible. Common reasons:
Submit
Thank you :)
Downvoting a post can decrease pending rewards and make it less visible. Common reasons:
Submit
Brilliant analysis. I love seeing charts like this because it helps me to understand more about the markets. I've not been involved in crytpocurrencies before and all new information gives me a little bit more light on the subject.
So, what do we think guys? If a million people register... will my $1,000 worth of Steem Power become worth a lot more, or will it be diluted?
Downvoting a post can decrease pending rewards and make it less visible. Common reasons:
Submit
IMO in such a case it would go up :)
Downvoting a post can decrease pending rewards and make it less visible. Common reasons:
Submit
Crazy
Downvoting a post can decrease pending rewards and make it less visible. Common reasons:
Submit
whats so crazy about it? :O
Downvoting a post can decrease pending rewards and make it less visible. Common reasons:
Submit
Maybe would be interesting to analyze also the Poloniex Steem market, which I think will be quite relevant in the future
Downvoting a post can decrease pending rewards and make it less visible. Common reasons:
Submit
definitly looking forward to doing that, but I wanna let some more time pas before I do it, hmmor is here maybe a chance to start the daily updates, as i have the feelin that the market attention will switch over to poloniex
Downvoting a post can decrease pending rewards and make it less visible. Common reasons:
Submit
Poloniex is a bigger market than Bittrex, for sure, so there is only to wait to have more historical data there, and see how much volume will generate on that exchange.
Congrats for your TA, may I also ask you to use Accumulation/Distribution for next analysis?
Downvoting a post can decrease pending rewards and make it less visible. Common reasons:
Submit
exactly my thought's, i like to have some history to do TA,
Sure will do my best to do so :)
Will need and find a way to pull alot of data out thou
Downvoting a post can decrease pending rewards and make it less visible. Common reasons:
Submit
If you need raw data (I mean numbers, not charts) I can help using some APIs, I use Coinigy which gives the possibility to retrieve data from many different exchanges using their API, and some scripting too ;)
Downvoting a post can decrease pending rewards and make it less visible. Common reasons:
Submit
Good work. Need update in some days and iy should good for you too ))
Downvoting a post can decrease pending rewards and make it less visible. Common reasons:
Submit
will definitly give my best and do it ;)
Downvoting a post can decrease pending rewards and make it less visible. Common reasons:
Submit
I more like to have simple chart as simple as it can rather than messy full of inficators...just my 2 cent
Downvoting a post can decrease pending rewards and make it less visible. Common reasons:
Submit
there's rly only 1 "indicator" on the chart, but moresoever I know my charts are messy but I like them that way cos they contain everything i'm looking for, but i'm sure I can find a way to make them nice and shiny for the psots;)
Downvoting a post can decrease pending rewards and make it less visible. Common reasons:
Submit
Espero que el precio siga subiendo. Doblé la inversión en solo un día. Gracias I hope that the price continue to rise.

I folded the investment in just one day. Thank you :)
Downvoting a post can decrease pending rewards and make it less visible. Common reasons:
Submit
I'm very happy for you , as well it's good for steem :)
Downvoting a post can decrease pending rewards and make it less visible. Common reasons:
Submit
Nice post Oz, will be good to see some transparency around STEEM price movement. To my mind cryptocurrencies are more volatile and sentiment driven than conventional stocks and currencies, so TA a lot more precarious for direction..... if trading them one needs very good SL management.
Downvoting a post can decrease pending rewards and make it less visible. Common reasons:
Submit
I agree with you on this point ;) but I also am the opinion that the news also impact the markets alot more in % wise movements then in traditional FIAT markets
Downvoting a post can decrease pending rewards and make it less visible. Common reasons:
Submit
I really like you post in #marijuana :)
And i love your charts, keep doing your work brother.
Maybe someday we will smoke some fat joint :) cheers
Downvoting a post can decrease pending rewards and make it less visible. Common reasons:
Submit
hehehe :) why not :) Thank you alot man!
will keep them accounts and posts separate from now on but I'll keep comenting with the main one
Downvoting a post can decrease pending rewards and make it less visible. Common reasons:
Submit
is there anywhere i can get real life surport and better chart anarlysis?
Downvoting a post can decrease pending rewards and make it less visible. Common reasons:
Submit
hospital, and defo on internet m8!
Downvoting a post can decrease pending rewards and make it less visible. Common reasons:
Submit
ths for sharing with us :)
Downvoting a post can decrease pending rewards and make it less visible. Common reasons:
Submit
no problem :)
Downvoting a post can decrease pending rewards and make it less visible. Common reasons:
Submit
I am about to get my first bit payout and was wondering what to do with it. This will be a huge help and will definitely use the knowledge. Namaste'!
Downvoting a post can decrease pending rewards and make it less visible. Common reasons:
Submit
Hope u decide with clear mind!:)
Downvoting a post can decrease pending rewards and make it less visible. Common reasons:
Submit
Guter Artikel.
Das gewaltige Potential von #STEEM haben bisher die Wenigsten erkannt. STEEM ist jetzt schon die Drittstärkste Kryptowährung hinter BTC und ETH. Gemessen an der Marktkapitalisierung.
Wir stehen noch ganz am Anfang. Ich bin gespannt auf die weitere Entwicklung. #STEEMIT !
Best Regards
____/)____
Downvoting a post can decrease pending rewards and make it less visible. Common reasons:
Submit
Denke ich auch, aber es kommt auch wie du es gesagt hast, auf die Entwicklung an ;)
Downvoting a post can decrease pending rewards and make it less visible. Common reasons:
Submit
Downvoting a post can decrease pending rewards and make it less visible. Common reasons:
Submit
If it will not be downside 0.0036, i think steem/btc is upside.
I dont worry about price action ,because i am long term invester.
I have make position at 0.00005.
Downvoting a post can decrease pending rewards and make it less visible. Common reasons:
Submit
Wow, I like the charts! Only thing I would argue about is the statement near the end "If the business model is good it can totally ignore the law of TA." I think it does not ignore the law of TA, it just creates it's own TA reality to follow instead. In a perfect world TA would always be self correcting and never be wrong. Since each TA is a snapshot in time reflecting the total accumulation of data up to that point, by the time the observer sees the TA he would need to be able to calculate the quantum difference of all the possible TA outcomes to predict the right one to follow. What came first, TA or the Trend?
Downvoting a post can decrease pending rewards and make it less visible. Common reasons:
Submit
Good job! Thx
Downvoting a post can decrease pending rewards and make it less visible. Common reasons:
Submit
thank you very much :)
Downvoting a post can decrease pending rewards and make it less visible. Common reasons:
Submit
Excellent, please consider making these post daily. I’ll be following, thank you
Downvoting a post can decrease pending rewards and make it less visible. Common reasons:
Submit
Good work my friend! Very nicely done and easy to follow
Downvoting a post can decrease pending rewards and make it less visible. Common reasons:
Submit
very good analysis - but you should still take into account the development and application steemit.com steemit related and user-created !!!
Downvoting a post can decrease pending rewards and make it less visible. Common reasons:
Submit
Also I did make a post about Ethereum Classic..

Check it out and please let me know what you think :D
https://steemit.com/ethereumclassic/@stealthtrader/is-ethereum-classic-replacing-ethereum
Downvoting a post can decrease pending rewards and make it less visible. Common reasons:
Submit
Dude... Definitely some awesome charting skills. This is the kind of stuff that I like! I'm definitely glad this is trending.
Although I can imagine this going over people's heads. I've heard people call TA "voodoo" on CNBC regarding stocks lol... then the stock respects the support and resistance levels.
Maybe one thing that sounds like an anomaly is that:
Bearish case: Once the price breaks through a resistance level, that resistance level turns into a support level.
Bearish case: If the price breaks a support level, that support level turns into a resistance level.
&nsbp;
I know a lot of people questioning why BTC "isn't going up" or "isn't going down", but even if it's volatile as all hell, it still feels like it's respecting the laws of TA.
Excellent charting skills. I bet you make bank trading futures, forex, etc.!
Have an upvote for a quality post!
Downvoting a post can decrease pending rewards and make it less visible. Common reasons:
Submit
my most favorite thing in the crypto world is the charts and graphs.. They are both beautiful and terrifying all at the same time. From a new person (raises hand) it'a the thing I like to look at the most. Even if I don't compleatly understand all of it just yet it's still beautifully complicated and simple all at the same time.
Downvoting a post can decrease pending rewards and make it less visible. Common reasons:
Submit
Hi.... Vote me back https://steemit.com/introduceyourself/@faraz/hi-everyone-my-name-is-faraz-nice-to-meet-all-people-on-steemit-love-steemit
Downvoting a post can decrease pending rewards and make it less visible. Common reasons:
Submit
Here is some information that may help the bullish fundamentals
https://steemit.com/steemit/@me-tarzan/steemit-membership-growth-projections-you-will-be-shocked
Downvoting a post can decrease pending rewards and make it less visible. Common reasons:
Submit
OZ we want daily charts man! You are nailing it. Keep posting please.
Downvoting a post can decrease pending rewards and make it less visible. Common reasons:
Submit
I love me some data analysis. Thank you!
Downvoting a post can decrease pending rewards and make it less visible. Common reasons:
Submit
No problem :) Thank you for dropping a comment :)
Downvoting a post can decrease pending rewards and make it less visible. Common reasons:
Submit
Thanks OZ! can you post an analysis on ETC/BTC?
Downvoting a post can decrease pending rewards and make it less visible. Common reasons:
Submit
I will but let it have some history first, there is too few data to do a TA on it
Downvoting a post can decrease pending rewards and make it less visible. Common reasons:
Submit
Downvoting a post can decrease pending rewards and make it less visible. Common reasons:
Submit
Downvoting a post can decrease pending rewards and make it less visible. Common reasons:
Submit
Thanks for the time you took to share this with me
Downvoting a post can decrease pending rewards and make it less visible. Common reasons:
Submit
no problem at all, I rly enjoy charting!
Downvoting a post can decrease pending rewards and make it less visible. Common reasons:
Submit
#Steemtodamoon
Downvoting a post can decrease pending rewards and make it less visible. Common reasons:
Submit
I need to know how to do this!!
Downvoting a post can decrease pending rewards and make it less visible. Common reasons:
Submit
Thanks for taking your time. Great analysis!
Downvoting a post can decrease pending rewards and make it less visible. Common reasons:
Submit
meep
Downvoting a post can decrease pending rewards and make it less visible. Common reasons:
Submit
very excellent @ozmaster ,, @ ozchartart
Downvoting a post can decrease pending rewards and make it less visible. Common reasons:
Submit
Thank's, it's the same person ;) i'll be commenting and responding to questions with @ozmaster
Downvoting a post can decrease pending rewards and make it less visible. Common reasons:
Submit
I used to do something like this (I predicted price changes) , but never got any attention for it (even though predictions were accurate 100% which is what matters the most) so I stopped.
But good luck to you!
Downvoting a post can decrease pending rewards and make it less visible. Common reasons:
Submit