We just saw a huge move few days ago with a huge volume like we've never seen before and we are in the stage were its exciting to be a part of this community.

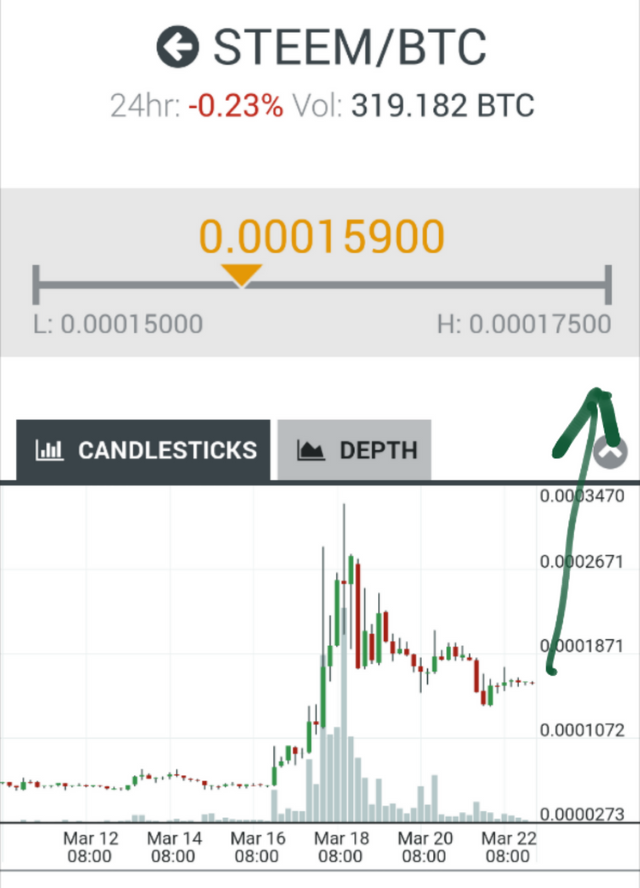
Here is a chart of the actual price action of steem and my very positive outlook of whats going to happen in the near future.
Price action favors the steem bulls.
First target will be our previous high. We have two possible scenario for this. If it touches the previous high at .00032 btc and pull back, it will retest its support line at 0.00015 btc. On the otherhand, a move over the resistance at its previous high will be our signal for the next major move.
I'm taking long position from here with stop loss below our critical support line at 0.00015.
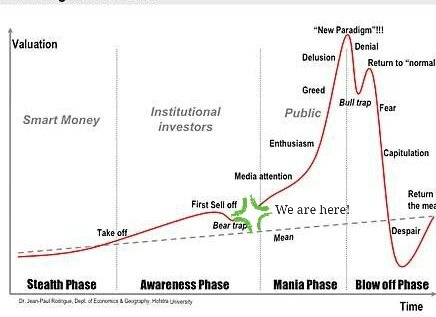
To show you the big picture of what is happening on steem, here is an image of the main stages of the market cycle.
Main Stages of a Market Cycle
Happy trading and stay safe!


The market cycle that you show is just a typical market cycle for a volatile instrument like this.
It doesn't give any sense for just how long those phases would be. It's interesting that in the longer term, the chart reverts to the mean, which looks like it would be just about where we are now. So, to make any money during these 2 phases, it would require really good timing.
Downvoting a post can decrease pending rewards and make it less visible. Common reasons:
Submit
or "thirds rule strategy"
Downvoting a post can decrease pending rewards and make it less visible. Common reasons:
Submit
I agree, that's why its important that you take profits when the trade starts to become profitable. You don't have to wait before it hits back the mean before you capitulate.
https://steemit.com/investment/@exyle/don-t-forget-to-take-your-profits-when-trading-crypto
Buy low sell high, and now is an opportunity that we can buy back steem this low. I'm quite sure we won't be seeing steem at this price levels in the coming months.
Downvoting a post can decrease pending rewards and make it less visible. Common reasons:
Submit
The thing is, the last chart you show, looks nothing like the actual STEEM chart.
This is a closer representation of the actual STEEM chart from what I see.
Downvoting a post can decrease pending rewards and make it less visible. Common reasons:
Submit
I respect your views. If that's how you see it...
Downvoting a post can decrease pending rewards and make it less visible. Common reasons:
Submit
The ending doesn't have to be like the one on my version though, that's still undetermined. ;)
Downvoting a post can decrease pending rewards and make it less visible. Common reasons:
Submit
Your version was the 10x pump and the downtrend after it. The outlook then was very negative... sentintiments have changed. People are starting to believe again. That volume 5 days ago was no joke... we have a new trend and I believe it will be bigger this time.
Downvoting a post can decrease pending rewards and make it less visible. Common reasons:
Submit