plotly
Visualize Your Data Modernly
Screenshots

 View Image |  View Image |
|---|---|
Hunter's comment
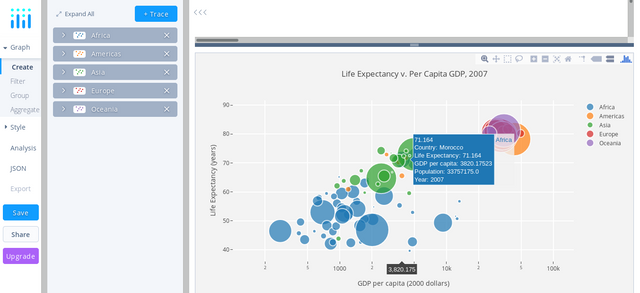
Are you a developer who plays with data and visualizes it as a report or presentation? Plot.ly is an open source tool that can be used to create, edit, and share data visualization interactively through the web.
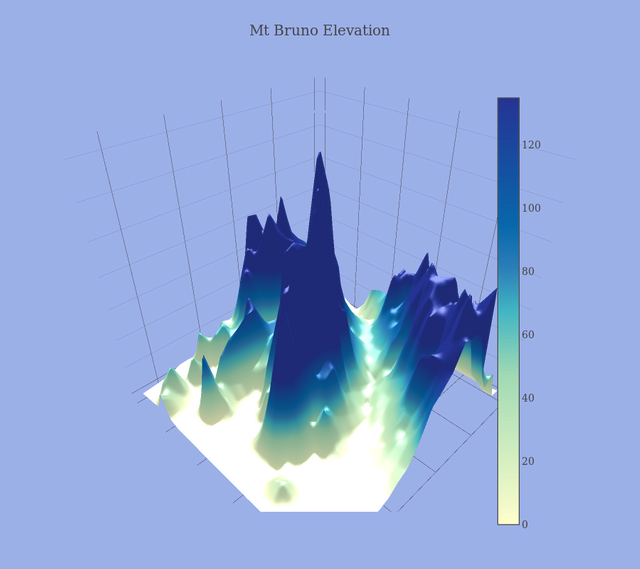
Plot.ly can be used to create charts, analytic data applications and create visual reports online.
Plot.ly is created using Python programming language and uses Django framework, JavaScript as front end and D3.js for visualization as well as HTML and CSS.
Link
Contributors
Hunter: @iqbaladan

This is posted on Steemhunt - A place where you can dig products and earn STEEM.
View on Steemhunt.com
Awesome hunt ! Your hunt is now verified.
Join us on Steemhunt's discord
https://discord.gg/3BG4r4q
We welcome your participation in our vibrant community
checkout @steemhunt for latest updates
Downvoting a post can decrease pending rewards and make it less visible. Common reasons:
Submit
Thanks, @bitrocker2020.
Downvoting a post can decrease pending rewards and make it less visible. Common reasons:
Submit
I figured out how to visualize the data I provided with Python without dealing with UI, it came to your post equivalence. I will definitely try, thank you.
Downvoting a post can decrease pending rewards and make it less visible. Common reasons:
Submit
You should try. Any way, Python has a lot options to do visualization 😎
Downvoting a post can decrease pending rewards and make it less visible. Common reasons:
Submit
I'm a rookie on Python but will learn everything! :D
Downvoting a post can decrease pending rewards and make it less visible. Common reasons:
Submit
Pros:
Cons:
Downvoting a post can decrease pending rewards and make it less visible. Common reasons:
Submit
Hi there, Thanks for giving your thoughts about pros and cons, Visualizing data and present it interactively is the best way to promote things I guess.
Downvoting a post can decrease pending rewards and make it less visible. Common reasons:
Submit
Congratulations!
We have upvoted your post for your contribution within our community.
Thanks again and look forward to seeing your next hunt!
Want to chat? Join us on:
Downvoting a post can decrease pending rewards and make it less visible. Common reasons:
Submit