Chartbrew
Visualize your data in one place
Screenshots

Hunter's comment
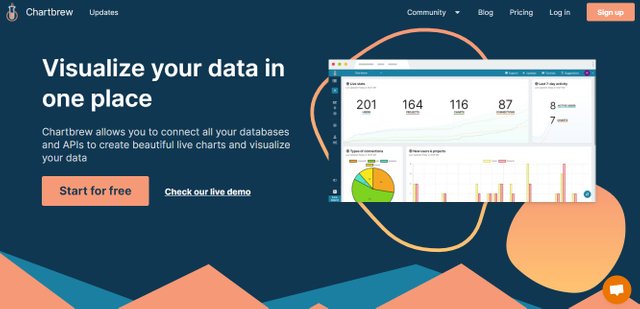
Chartbrew allows you to connect all your databases and APIs to create beautiful live charts and visualize your data. Visualize your data in one place. Only one dashboard to view, create and share your data. Connect to your data sources. Build your charts using its data editor and visualize your data easily.
Link

This is posted on Steemhunt - A place where you can dig products and earn STEEM.
View on Steemhunt.com
Good for managing the data and see in easy format
Downvoting a post can decrease pending rewards and make it less visible. Common reasons:
Submit
Visualization is the easiest and effective way of understanding data. Seems a nice way to get extract from large data. Nice hunt
Downvoting a post can decrease pending rewards and make it less visible. Common reasons:
Submit
With Chartbrew we can easily Visualize our data in one place.
Downvoting a post can decrease pending rewards and make it less visible. Common reasons:
Submit
Congratulations!
We have upvoted your post for your contribution within our community.
Thanks again and look forward to seeing your next hunt!
Want to chat? Join us on:
Downvoting a post can decrease pending rewards and make it less visible. Common reasons:
Submit