Its been another great week for STEEM traders and investors.
Keen to learn more about the Volume vs Time dynamics in the STEEM/BTC market I've run a few statistics to learn more about the nature of this beast.
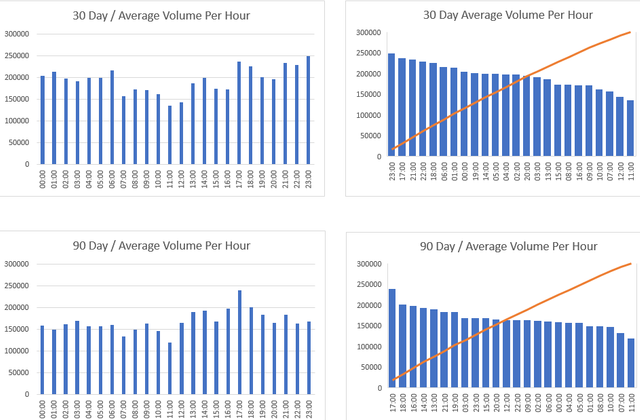
The graph below shows the volume accumulated average of each 60 minute period in a day, over the last 7 days (all times are GMT UK Time)

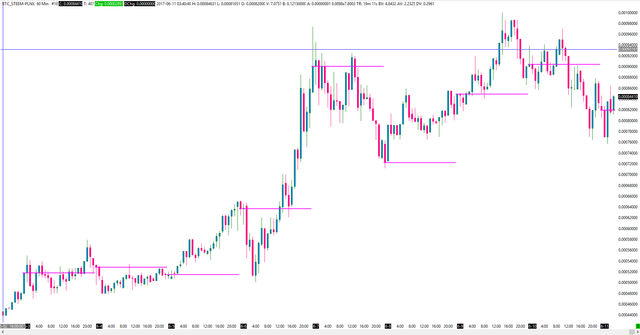
Over the last 7 days, the 23:00 - 23:59 hour has won the highest volume of the days.
The chart below marks the Closing price of the 23:00 bar so you can visually see how price manoeuvres around this level.

7 days isnt a very large sample size to work from, but its a start in learning about the nature of how this market moves.
The next graph shows the previous 30 days volume accumulated average of each 60 minute period in a day, which is very similar to the 7 day graph.

Using 90 days accumulate data for each 60 minute period highlights a clear anomaly with the 17:00 bar (5pm GMT UK Time)
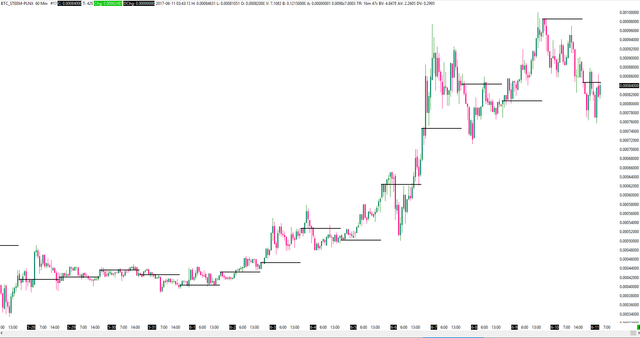
Below is the STEEM/BTC chart with the 17:00 bar closing price marked as the black line.

where can someone see those stats? I am a newbie in here and at the moment i am seeing some statistics from coinmarketcap but i am sure that there are pages with a lot more information, i just didn't find the time to search for them yet.
Downvoting a post can decrease pending rewards and make it less visible. Common reasons:
Submit
I use Sierrachart to pull the data from Poloniex and extract the data to a spreadsheet. I could run this study for a specific market if you like, or if theres another stat you want i can try help?
Downvoting a post can decrease pending rewards and make it less visible. Common reasons:
Submit
At the moment i don't have something in mind. If something occurs I will come back :) thank you very much and i already bookmarked sierrachart to search it in the future.
So those data are only from Poloniex? maybe if you collected data from all markets we would have a better representation of the overall trends.
Downvoting a post can decrease pending rewards and make it less visible. Common reasons:
Submit
Anytime mate. Yes a solid data source with larger sample size is something im keen to find, extracting this data from Poloniex is progress on this quest, and hopefully there are solutions.
Downvoting a post can decrease pending rewards and make it less visible. Common reasons:
Submit
Congratulations @coinbalance! You received a personal award!
You can view your badges on your Steem Board and compare to others on the Steem Ranking
Do not miss the last post from @steemitboard:
Vote for @Steemitboard as a witness to get one more award and increased upvotes!
Downvoting a post can decrease pending rewards and make it less visible. Common reasons:
Submit