Representing Data using a Picture Graph
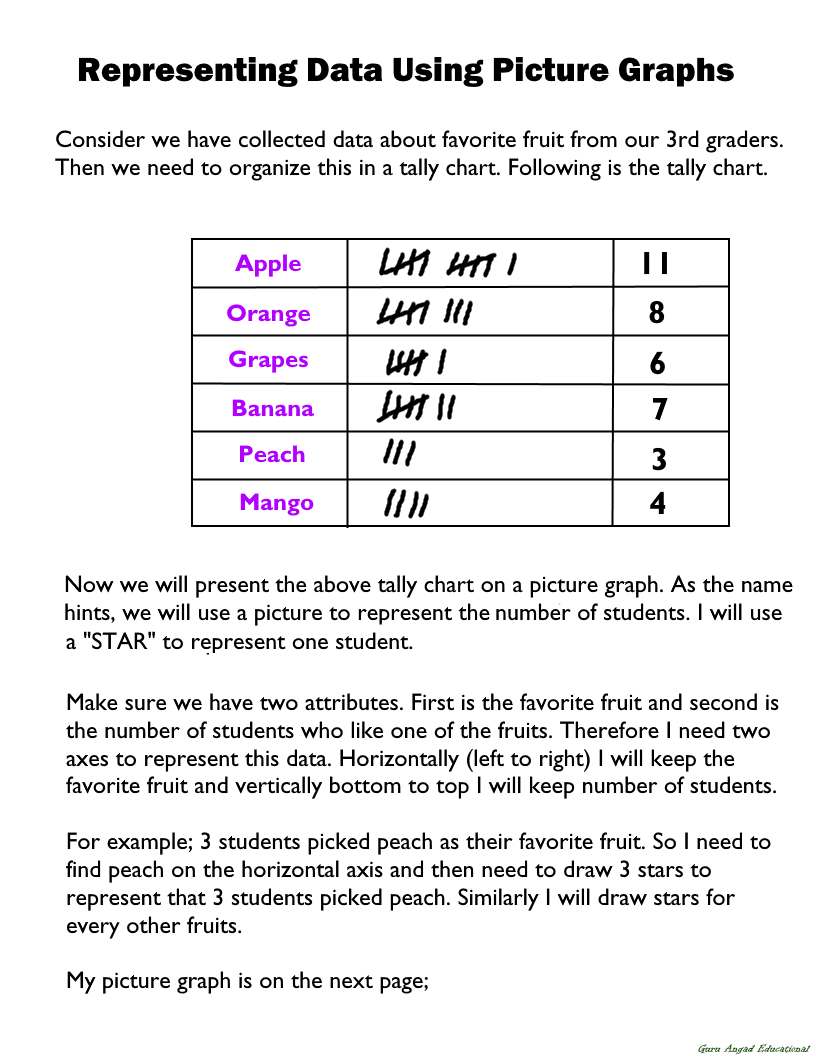
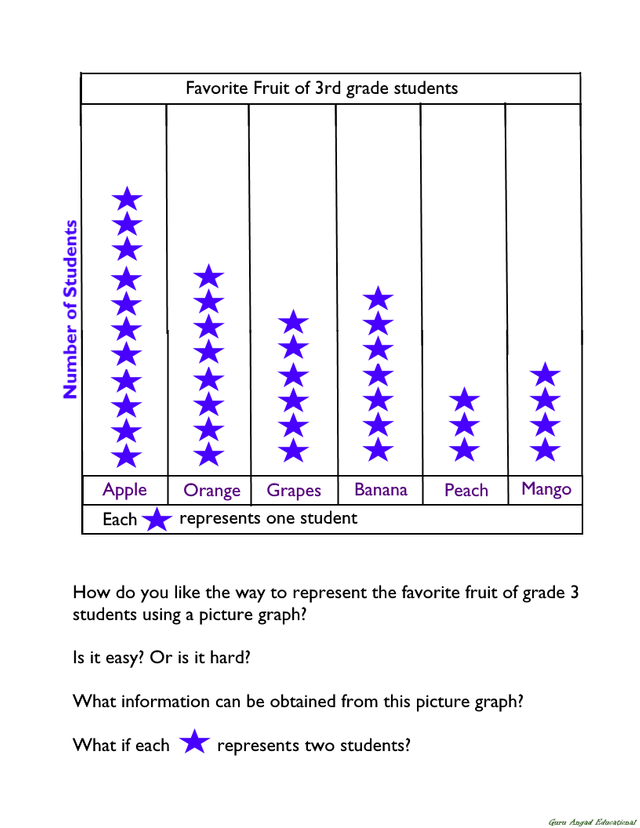
The easiest way to represent simple data is to use a picture graph and this is the best method to represent data in the beginning stages. We will introduce this method to our kids in elementary grades.
Below are the activity sheets I prepared for 3rd grade students to learn more about the picture graphs;


Downvoting a post can decrease pending rewards and make it less visible. Common reasons:
Submit
another hit and best post. thanks brother.
Downvoting a post can decrease pending rewards and make it less visible. Common reasons:
Submit
@mukhtarilyas, very easy for children because the data displayed is in the environment @mathworsheets. the child can also record his attendance to the school and a list of visits to a friend's sick house. can be displayed in the graph. thanks friends
Downvoting a post can decrease pending rewards and make it less visible. Common reasons:
Submit
Great combination of the grap and content.. sir
Downvoting a post can decrease pending rewards and make it less visible. Common reasons:
Submit
wow wonderful sir.
Downvoting a post can decrease pending rewards and make it less visible. Common reasons:
Submit
This is awesome sir you are doing a great job.
Downvoting a post can decrease pending rewards and make it less visible. Common reasons:
Submit
Excellent that is wonderful sheets for kids to practice
Downvoting a post can decrease pending rewards and make it less visible. Common reasons:
Submit
a good graphic way
Downvoting a post can decrease pending rewards and make it less visible. Common reasons:
Submit
It's for your
2ND GRADE MATH CORE CURRICULUM
Downvoting a post can decrease pending rewards and make it less visible. Common reasons:
Submit
learn some new from you.
Downvoting a post can decrease pending rewards and make it less visible. Common reasons:
Submit
This is very interesting topic @mathworksheets. Thanks for recalling my old memories.
Downvoting a post can decrease pending rewards and make it less visible. Common reasons:
Submit