
Time= 10:37AM Mon10 June 2019
UFOtext=
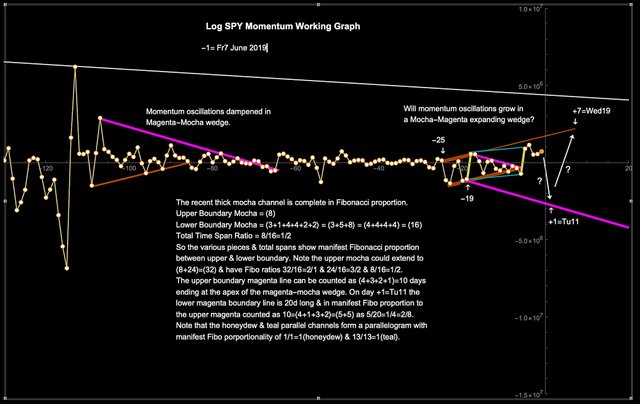
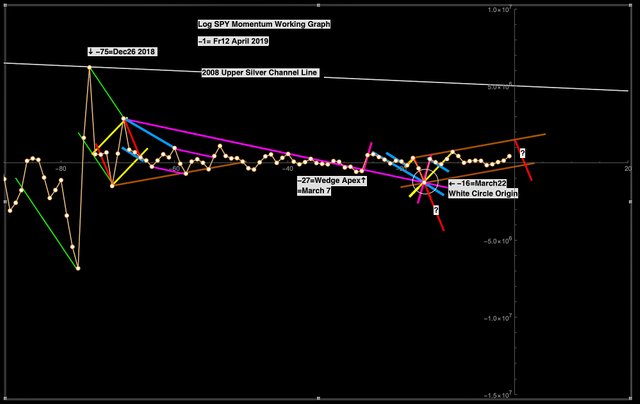
Momentum graph suggests SPY volatility might pick up. The 2nd graph shows the post Christmas 2018 parallel boundary network looks similar to the recent action but in reverse.
Authors get paid when people like you upvote their post.
If you enjoyed what you read here, create your account today and start earning FREE STEEM!
If you enjoyed what you read here, create your account today and start earning FREE STEEM!