Today i am gonna write about Japanese candlesticks and their advantages versus line graphs.
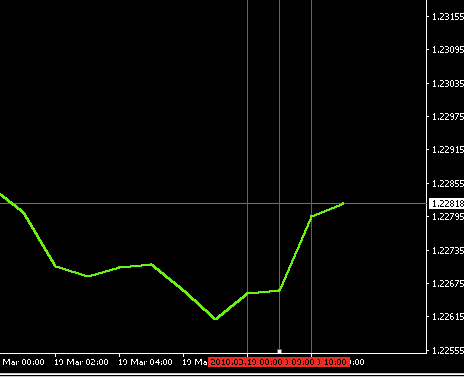
Beginners who are new to trading and charts will find line graphs easier to use since it is very simple, but simple does not always means good. Since it gives us much less information about price movement than Japanese candlesticks or western lines. Whenever we are looking at the price chart we see how price is changing over the time, lets say we are looking EUR/USD at 1 hour line graph chart we see how price is changing from hour to hour, That is all the information we are getting.

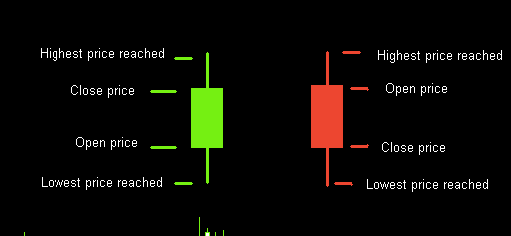
In a case of Japanese candlesticks, We not only where the price is going, but also how it is moving. As mentioned above line graph shows the price change from time to time, lets say at 19:00 price was 1.1400 and at 20:00 it became 1.1425 it only gives us two price points(open price, close price). Candlestick gives us 4 price points which gives us more tools to analyze the market.

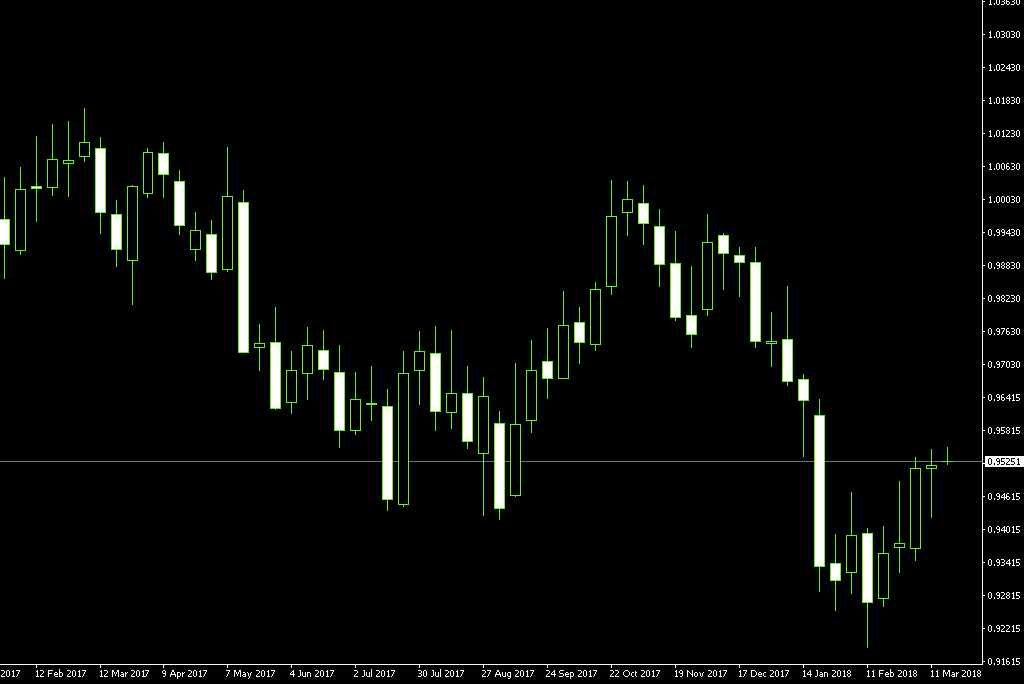
As you see these candlesticks have different colors. Usually brighter color represents bullish candlesticks which means that closing price is higher than opening. Darker color represents bearish candlestick which means that closing price is lower than opening price. Range from open to close prices is called the ,,body".
The sin parts of the candles are called shadows which chows the highest and lowest price recorded during the period.
Every candlestick show some period of time for example, if we are looking at 1 day chart, each candlestick represents one day, if looking at 1 min chart each candlestick represents one minute.

Hi! I am a robot. I just upvoted you! I found similar content that readers might be interested in:
http://stockcharts.com/school/doku.php?id=chart_school:chart_analysis:introduction_to_candlesticks
Downvoting a post can decrease pending rewards and make it less visible. Common reasons:
Submit