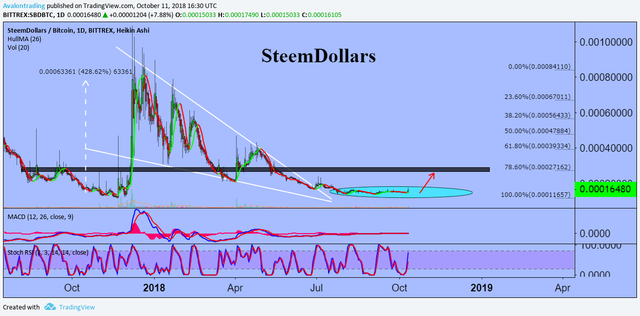
On the daily chart you can see how the price left the falling wedge pattern. A falling or descending wedge is one of the figures (patterns) that signal a bullish reversal.
At the moment, SBD / BTC is in a volume accumulation stage.
This is the best place to buy and long-term asset retention at this level (smart money comes in).
Fibonacci 78.6 First Target
На дневном графике можно увидеть как цена покинула паттерн падающий клин. Падающий или нисходящий клин является одной из фигур (паттернов), сигнализирующих о бычьем развороте.
На данный момент SBD/BTC находится в стадии накопления объёма.
Это лучшее место для покупки и долгосрочного удержания актива на данном уровне (заходят умные деньги).
Первая цель по графику уровень фиббоначи 78.6
Congratulations @avalonprosky! You have completed the following achievement on the Steem blockchain and have been rewarded with new badge(s) :
Click on the badge to view your Board of Honor.
If you no longer want to receive notifications, reply to this comment with the word
STOPDo not miss the last post from @steemitboard:
Downvoting a post can decrease pending rewards and make it less visible. Common reasons:
Submit