Why look on Redfish Trade History?
It is important to track Redfish History if you are on this coin and if you are not yet. WHY?
Because, through its history, we can predict its next move, If its going down or up!
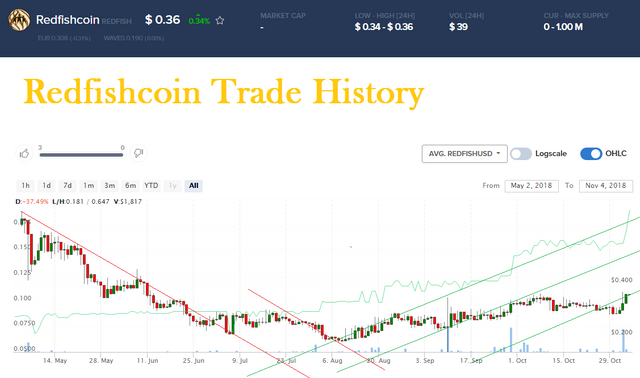
According to graph above from May 2018 to August, Redfish value continue going Down!
That is in DOLLAR value
But Notice the thin GREEN line, this is the Redfish/Waves pair. It has a steady or moving little up but never go down in long term!
The good news is that Since august, up to now, November, Redfishcoin show some sign of going upward. Also, There is a good upward trend in Redfish/Waves, the THIN green line!.
In my opinion, When Waves value begins to move up and BTC will be in Uptrend also, we know what is the Reason, December is coming!
Redfishcoin will be around $2 each!
Also, Redfishcoin is showing Stability in delivering its promise.
Earning Monthly Shares is a good reason to hold your coin!
So if you are not yet in Redfishcoin, Buy and Hold to earn 3%-10% monthly shares!

Congratulations @minnowcoin! You have completed the following achievement on the Steem blockchain and have been rewarded with new badge(s) :
Click here to view your Board of Honor
If you no longer want to receive notifications, reply to this comment with the word
STOPDo not miss the last post from @steemitboard:
Downvoting a post can decrease pending rewards and make it less visible. Common reasons:
Submit