EN
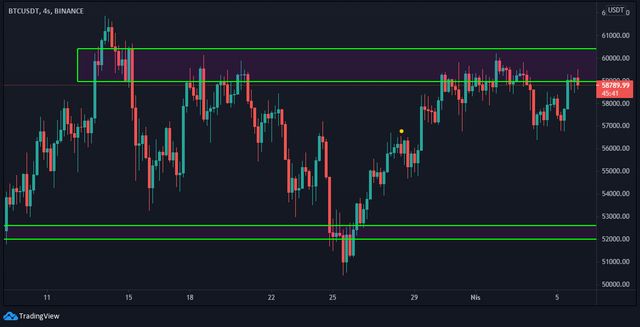
Hello. I wanted to share my Bitcoin chart with you. The graph is 4 hours. Retrieved from Tradingview.com, Binance exchange's BTC / USDT data. As seen in the graph, there is a supply and demand zone at the level of $ 52,000. Likewise, there is a resistance zone at 58.000-60.0000 level. We continue to follow. Let's see which way it will break.
Note: I do not give investment advice. Please see my posts as an education.

TR
Merhaba. Bitcoin grafiğimi sizinle paylaşmak istedim. Grafik 4 saatliktir. Veriler Tradingview.com'dan, Binance borsasının BTC / USDT alındı.
Grafikte görüldüğü gibi 52.000 dolar seviyesinde bir arz ve talep bölgesi var. Aynı şekilde 58.000-60.0000 seviyesinde bir direnç bölgesi var. Takip etmeye devam ediyoruz. Bakalım hangi yönden kırılacak.
Not: Yatırım tavsiyesi vermiyorum. Lütfen gönderilerime eğitim olarak bakın.
Bey, yazılarının türkce de olmasını isterik.
Downvoting a post can decrease pending rewards and make it less visible. Common reasons:
Submit
Teşekkürler Revan. Türkçesini de ekledim.
Downvoting a post can decrease pending rewards and make it less visible. Common reasons:
Submit
ben teşekkür ederim, var olasın.
Downvoting a post can decrease pending rewards and make it less visible. Common reasons:
Submit