
Details
A real-time visualisation of the Greenhouse Gas (in terms of CO2 equivalent) footprint of electricity consumption built with d3.js, optimized for Google Chrome.
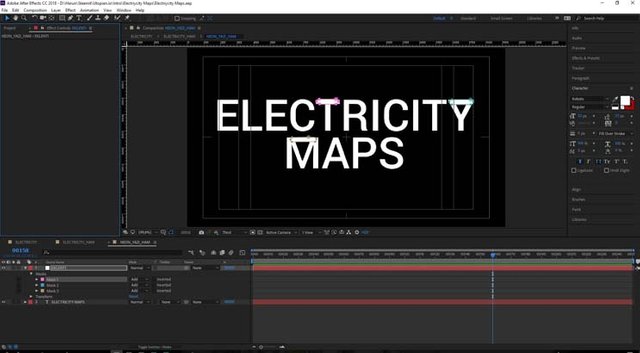
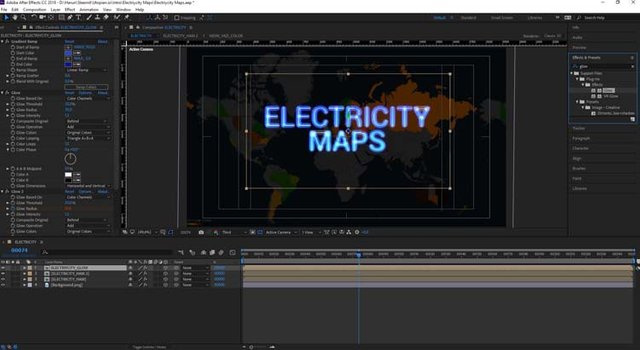
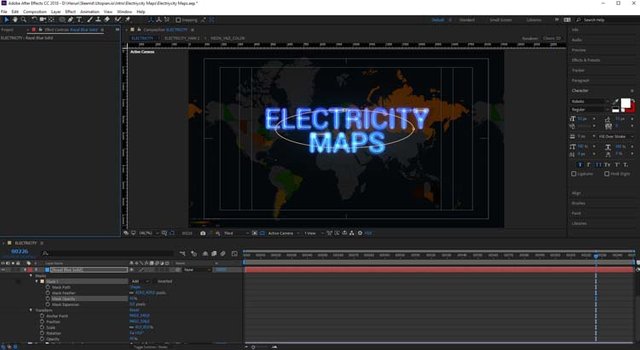
This is my new design intro for the Electricity Maps. The reason I designed a new intro for this site haven't got intro and it is for it to have a new good icon that will be recognizable much better than the existing.
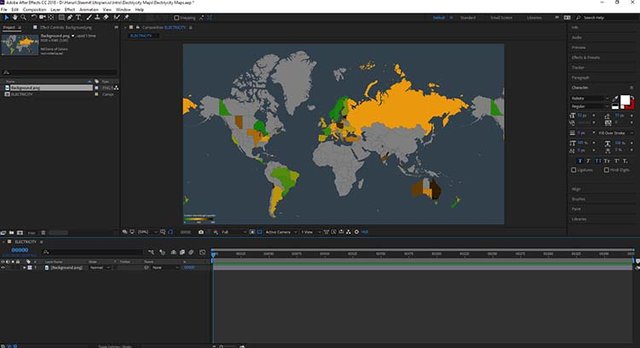
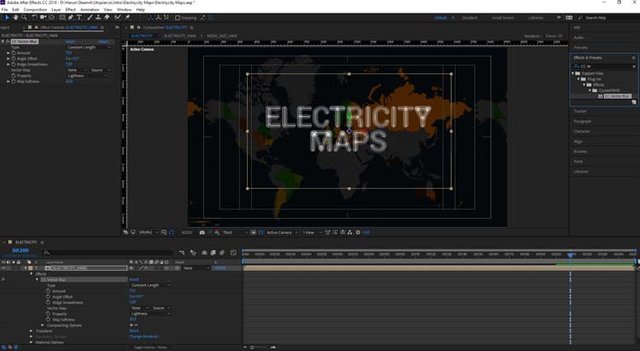
I took the background as a screenshot from the electricitymaps.gov site.
Intro
Benefits / Improvements
It contributes to the introduction part of the promotional videos of the program.
It is also used in all course narration and practice videos.
Tools
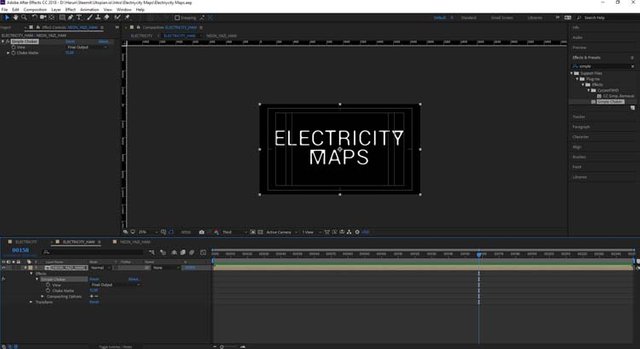
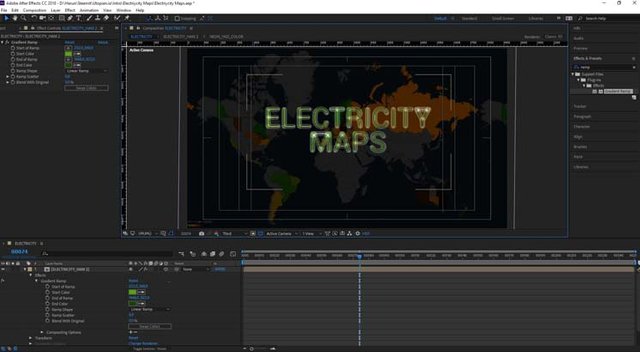
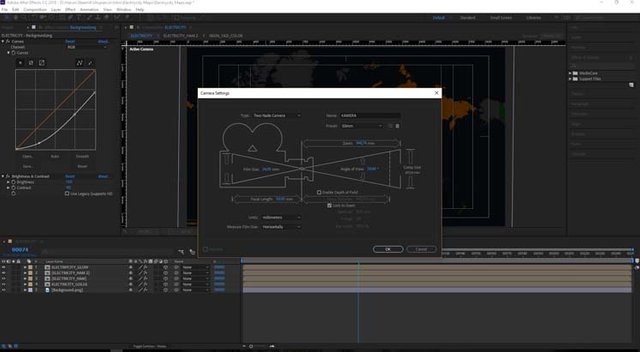
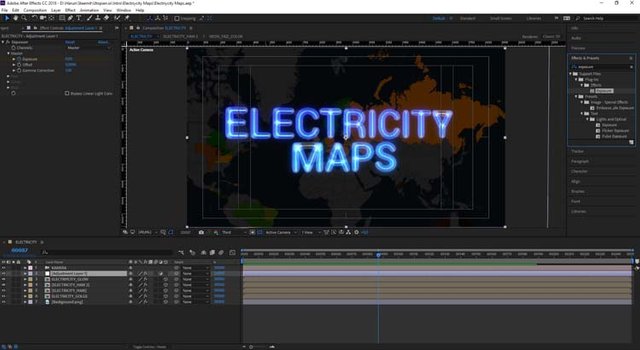
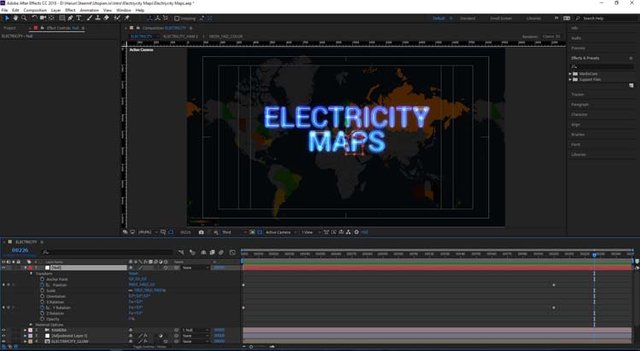
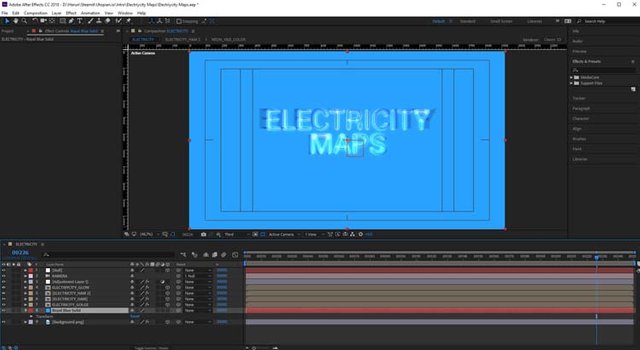
I used Adobe After Effects CC 2018 version in creating the intro.
Proof of work;
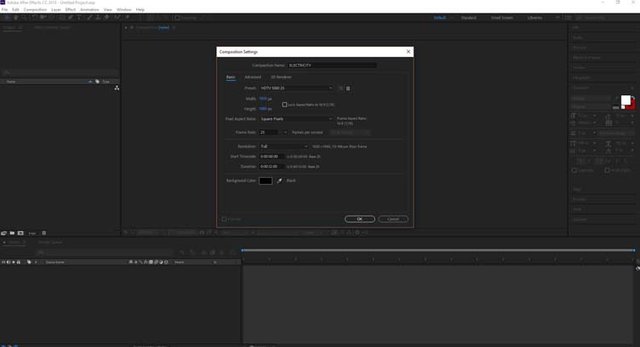
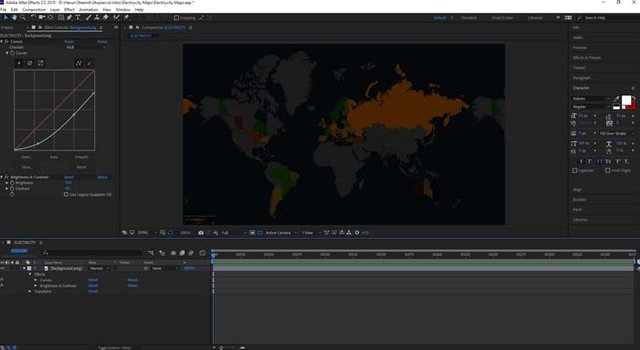
Now let's see how we do it step by step.
Original files
- Github
- You can download all files here
- Free Fonts
- Free Sound Effect 1
- Free Sound Effect 2
- Electricity Maps Website
Posted on Utopian.io - Rewarding Open Source Contributors
Your contribution cannot be approved because it does not follow the Utopian Rules.
You can contact us on Discord.
[utopian-moderator]
Downvoting a post can decrease pending rewards and make it less visible. Common reasons:
Submit