If you need a chart library to make data-visualization on your site I'll recommend this chartist.js. This library can make and customize the chart as you prefer. So, in this tutorial will show you how to using it.
What Will I Learn?
- Installing Chartist from CDN
- Using Chartist to make chart
Requirements
- Knowledge of HTML and CSS
- Knowledge of Javascript
Difficulty
- Basic
Tutorial Contents
Data
Before we use chartist and make a chart we need a data. In this case we make chart with dummy data. Here is the data:
| Month | Visitor |
|---|---|
| Jan | 4000 |
| Feb | 3000 |
| Mar | 1120 |
| Apr | 2450 |
| May | 7080 |
| Jun | 9980 |
| Jul | 7040 |
| Aug | 6600 |
| Sep | 4144 |
| Oct | 5025 |
| Nov | 2020 |
| Dec | 3956 |
Installing
First we need a project file to make a chart sample. In this tutorial I have a file called chart.html. Then in the file project we must declare html tag. After that we must installing chartist.js from CDN. We must put chartist css before end of head tag and put chartist js before end of body tag. Here is the codes:
<html>
  <head>
    <title>Chartist</title>
    <link rel="stylesheet" href="https://cdnjs.cloudflare.com/ajax/libs/chartist/0.11.0/chartist.min.css">
  </head>
  <body>
    <script src="https://cdnjs.cloudflare.com/ajax/libs/chartist/0.11.0/chartist.min.js"></script>
  </body>
</html>
Usage
Well, chartist.js has been installed. Next we must declare some code to rendering the chart on canvas. In this tutorial I'll make two canvas to rendering line area chart and bar chart. Then initialize with two different id. Line id to represent the line area chart and bar id represent the bar chart.
Here are the codes:
<html>
  <head>
    <title>Chartist</title>
    <link rel="stylesheet" href="https://cdnjs.cloudflare.com/ajax/libs/chartist/0.11.0/chartist.min.css">
  </head>
  <body>
    <div style="height:400px;">
      <div id="line" style="float:left;width:50%;height:100%;"></div>
      <div id="bar" style="float:left;width:50%;height:100%;"></div>
    </div>
    <script src="https://cdnjs.cloudflare.com/ajax/libs/chartist/0.11.0/chartist.min.js"></script>
  </body>
</html>
That's code make two grid column one column for line chart and the other to bar chart. But, must declare code to initialize chart and rendering to canvas. First we must initialize the data, in this case the data uses for line chart and bar chart. So, we put data in variables, dataLabels variable for set the month represent labels on chart and dataSeries variable to set the data series and represent chart value. Then we initialize code in javascript tag to make line area chart and put before end of tag. Here are the codes:
<html>
  <head>
    <title>Chartist</title>
    <link rel="stylesheet" href="https://cdnjs.cloudflare.com/ajax/libs/chartist/0.11.0/chartist.min.css">
  </head>
  <body>
    <div style="height:400px;">
      <div id="line" style="float:left;width:50%;height:100%;"></div>
      <div id="bar" style="float:left;width:50%;height:100%;"></div>
    </div>
    <script src="https://cdnjs.cloudflare.com/ajax/libs/chartist/0.11.0/chartist.min.js"></script>
    <script type="text/javascript">
      var dataLabels = ['Jan', 'Feb', 'Mar', 'Apr', 'May', 'Jun', 'Jul', 'Aug', 'Sep', 'Oct', 'Nov', 'Dec'];
      var dataSeries = [4000, 3000, 1120, 2450, 7080, 9980, 7040, 6600, 4144, 5025, 2020, 3956];
      new Chartist.Line('#line', {
        labels: dataLabels,
        series: [
          dataSeries
        ]
      }, {
        low: 0,
        showArea: true,
      });
    </script>
  </body>
</html>
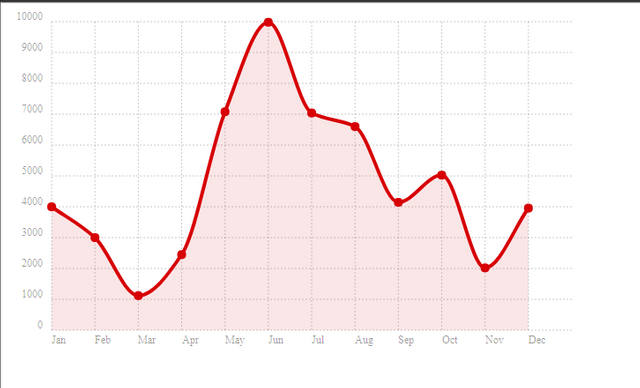
Now, we have line chart. Two variables as the data container to represent the value of line area chart. Then we call the variables on the chartist.line. Then we declare some options, low option to make line chart value start from 0. showArea option to show the area color of chart. It's looks like:

As we can see, the red line chart with areas show the value each data from variables. Next, we can make bar chart. Then we just declare code to make bar chart and rendering chart using dataLabels and dataSeries variables. Here is the codes:
<html>
  <head>
    <title>Chartist</title>
    <link rel="stylesheet" href="https://cdnjs.cloudflare.com/ajax/libs/chartist/0.11.0/chartist.min.css">
  </head>
  <body>
    <div style="height:400px;">
      <div id="line" style="float:left;width:50%;height:100%;"></div>
      <div id="bar" style="float:left;width:50%;height:100%;"></div>
    </div>
    <script src="https://cdnjs.cloudflare.com/ajax/libs/chartist/0.11.0/chartist.min.js"></script>
    <script type="text/javascript">
      var dataLabels = ['Jan', 'Feb', 'Mar', 'Apr', 'May', 'Jun', 'Jul', 'Aug', 'Sep', 'Oct', 'Nov', 'Dec'];
      var dataSeries = [4000, 3000, 1120, 2450, 7080, 9980, 7040, 6600, 4144, 5025, 2020, 3956];
      new Chartist.Line('#line', {
        labels: dataLabels,
        series: [
          dataSeries
        ]
      }, {
        low: 0,
        showArea: true,
      });
      new Chartist.Bar('#bar', {
        labels: dataLabels,
        series: dataSeries
      }, {
        distributeSeries: true
      });
    </script>
  </body>
</html>
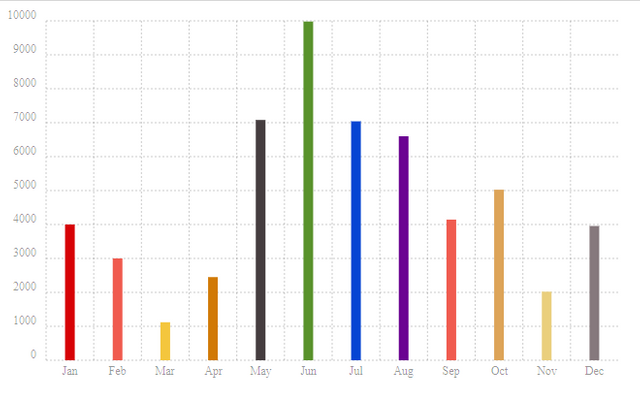
Same as the line area chart we put each variables on labels and series option then we must set distributeSeries to true value to rendering bar chart on canvas. Here is the bar chart

Then chartist automatically render each data with different color.
Conclusion
This tutorial just propived a basic introduction of the Chartist.js library and showed you how to use it to create line area and bar charts. You also learned about different configuration options and dataset that can be used to control the appearance of different charts. For more the configuration options to apllied all chart types, you can see documentation on official site Chartist.js
To see the demo and fully codes of this tutorial you can debug here:
See the Pen Chartist by Rio Dwi Prabowo (@riyos94) on CodePen.
Thank youPosted on Utopian.io - Rewarding Open Source Contributors

Your contribution cannot be approved because it does not follow the Utopian Rules.
Your examples really aren't any different than the [examples given on their official website], which makes your tutorial unnecessary.
You can contact us on Discord.
[utopian-moderator]
Downvoting a post can decrease pending rewards and make it less visible. Common reasons:
Submit
Congratulations @riyo.s94! You have completed some achievement on Steemit and have been rewarded with new badge(s) :
Click on any badge to view your own Board of Honor on SteemitBoard.
For more information about SteemitBoard, click here
If you no longer want to receive notifications, reply to this comment with the word
STOPDownvoting a post can decrease pending rewards and make it less visible. Common reasons:
Submit
Congratulations @riyo.s94! You received a personal award!
Click here to view your Board of Honor
Downvoting a post can decrease pending rewards and make it less visible. Common reasons:
Submit