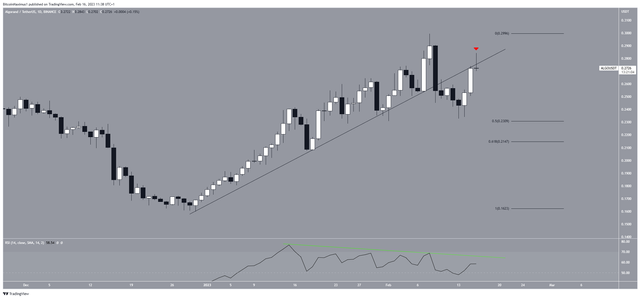
In contrast to the somewhat fuzzy signals of the weekly chart, the daily timeframe promises a decline in price before it can start rising again. There are two factors in favor of this scenario.
First, ALGO made a bearish break of the upside support line and then tested it as resistance (red icon). Second, this decline was preceded by bearish divergence signals on the RSI (green line), and the trend line of this indicator is still intact.
Accordingly, the most likely scenario promises the token to decline towards Fibo support levels of 0.5-0.618.
On the other hand, a recovery above this line would cancel the bearish outlook for Algorand. In this case, the market may start growing in the direction of the previously highlighted long-term resistance at $0.410.
Thus, the most probable scenario for the token this month is its decline towards the support levels of Fibo 0.5-0.618 at $0.215-$0.231. Meanwhile, a recovery above the short-term upward support line would mean that ALGO could rise to $0.410.
