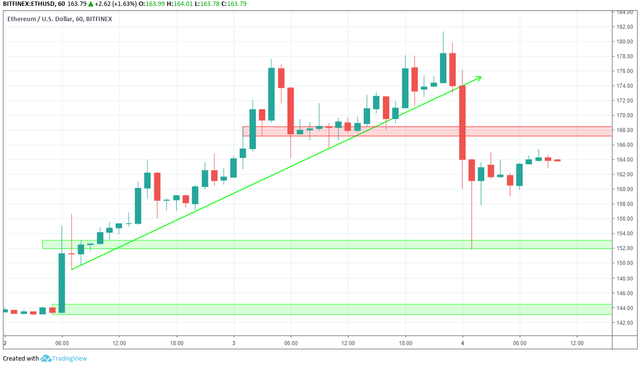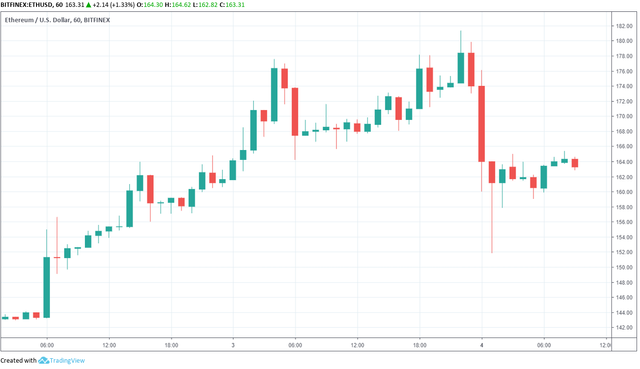
On Apr 2, 2019 the price of Ethereum (ETH) made an hourly low of $143.17. A sharp upward move ensued.
Ethereum reached a high of $181 on Apr 4 before dropping to a low of $151.82.
Is Ethereum going to drop below $150? Let’s find out.

Ethereum (ETH) Prices: Apr 2 – Apr 4
Ethereum (ETH): Trends and Highlights for April 4, 2019
- The price of Ethereum made a rapid upward move on Apr 3.
- ETH/USD was following a steep ascending support line.
- Ethereum broke down from the line on Apr 3.
- There is resistance near $168 and support areas near $154 and $144
Ascending Support
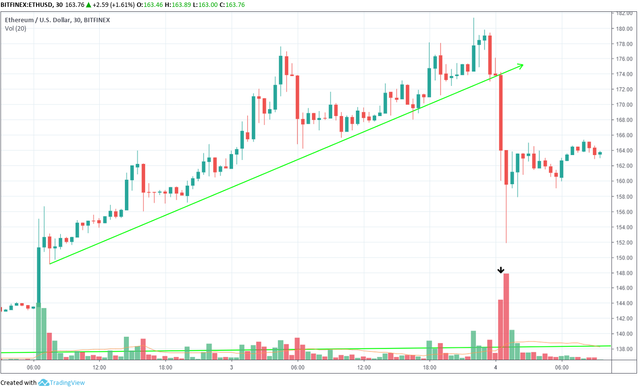
Tracing these lows gives us an ascending support line:

The price broke down from the support line on Apr 4.
As visible in the graph, the breakdown occurred in significant volume, giving validity to the move.
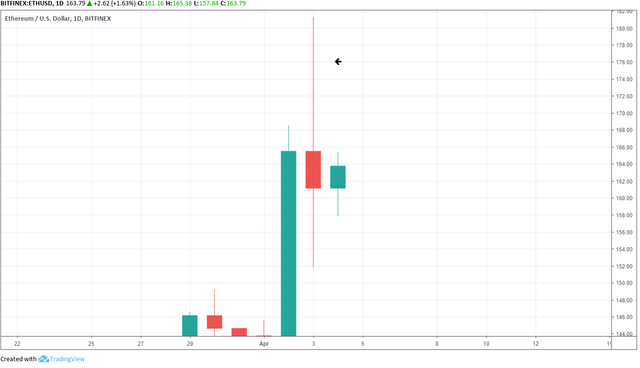
Shooting Star

However, the long lower wick is not in agreement with the definition of the shooting star candle. This indicates that there is still buying power left.
If the current daily candle is a bearish one, it would complete the pattern initiated by the shooting star candle. If however, the price closes above yesterday’s high, the pattern will be invalidated.
Reversal Areas

The first support area is located near $153. The second one is found near $144. Ethereum reached the first one during the low on Apr 4.
The closest resistance area is found near $168.
We believe that Ethereum will create a trading pattern between two of these areas, most likely $152 and $168.
Summary of Analysis
Based on this analysis, the price of ETH is likely to trade between two of the areas outlined above.
Do you think ETH will drop to the support areas above? Let us know your thoughts in the comments below.
Disclaimer: This article is not trading advice and should not be construed as such. Always consult a trained financial professional before investing in cryptocurrencies, as the market is particularly volatile.
Posted from Bittabi Bittabi.com : https://bittabi.com/eth-usd-price-prediction-for-04-04-2019-a-bearish-ethereum-drops-toward-150/
Warning! This user is on my black list, likely as a known plagiarist, spammer or ID thief. Please be cautious with this post!
If you believe this is an error, please chat with us in the #cheetah-appeals channel in our discord.
Downvoting a post can decrease pending rewards and make it less visible. Common reasons:
Submit