Here is how I used simple statistics for solving my problem.
It is now two years that I’m a commuter going back and forth from Bologna to Reggio Emilia in Italy.
I use the train for my travel as a commuter but the problem is that in Italy trains are always delayed. The reason for this is that the railway network infrastructure is old and requires constant maintenance which in turn causes delays.
There can also be strikes from the Trenitalia employees and in those days many trains are delayed or even cancelled.
Another reason for a delay is given by people committing suicide by deciding to die under a train.
Those delays can make your life as a commuter pretty hard especially if you are a father and husband. So I decided to use my skills as data analyst to try and do something about it in order to organize better my behavior as a commuter .
Being the last two cases (strikes and suicides) unpredictable I decided to consider only the delays caused by maintenance for my analysis.
For the analysis I gathered data from the Trenitalia - ViaggiaTreno (http://www.viaggiatreno.it/viaggiatrenonew/index.jsp) API online services that monitors all the trains traveling in Italy in real time.
There is this repository in github for further instructions if you want to try and make a parser for the API : bluviolin/TrainMonitor (https://github.com/bluviolin/TrainMonitor/wiki/API-del-sistema-Viaggiatreno)
I build a client that would query the API of Trenitalia - ViaggiaTreno (http://www.viaggiatreno.it/viaggiatrenonew/index.jsp) and take the programed time of arrival of the train in a certain station. I would then confront this with the real time of arrival of the train and by subtracting these two times I could calculate the delay of arrival in minutes.
I gathered data everyday for one month but I’m still going on with collecting data. By using those data, I calculated the average daily delay which is about 6 minutes per station and about 13 minutes per day. However the average will increase as I go on with collecting more data.
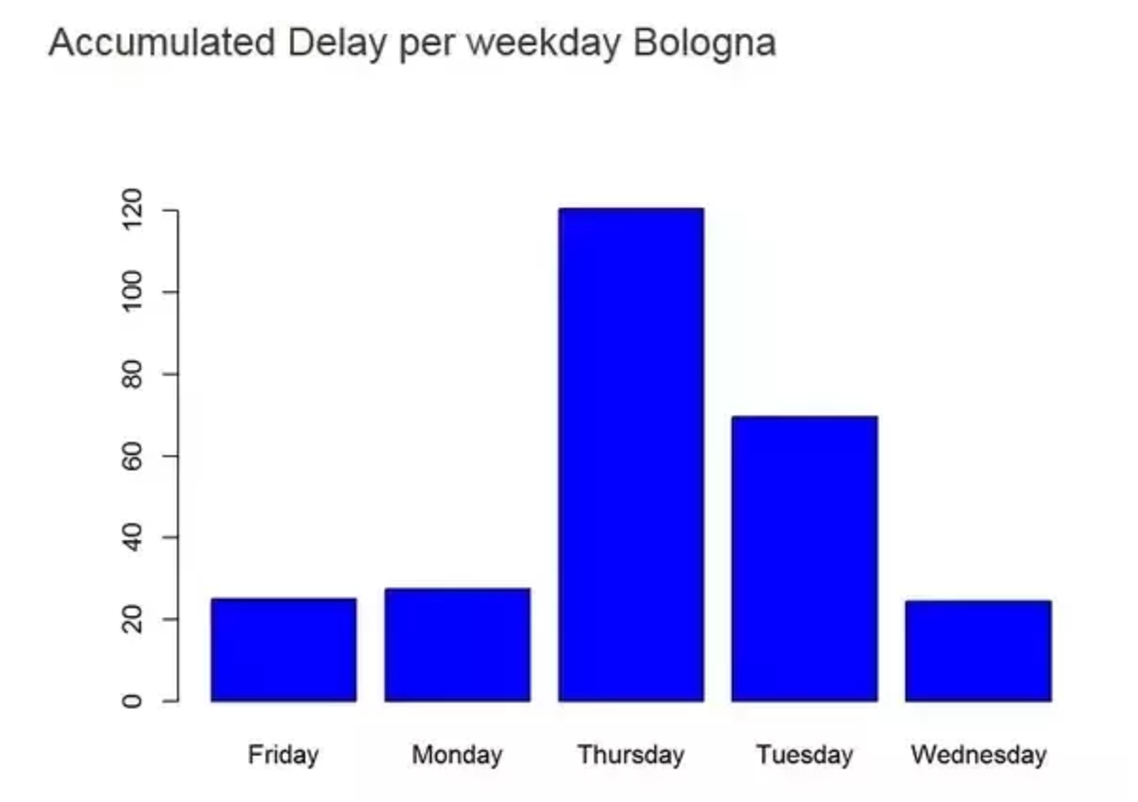
Another simple analysis I did was the following : for each day I aggregated the delays by calculating the accumulated delay for the working days of the week as of the graphics below.

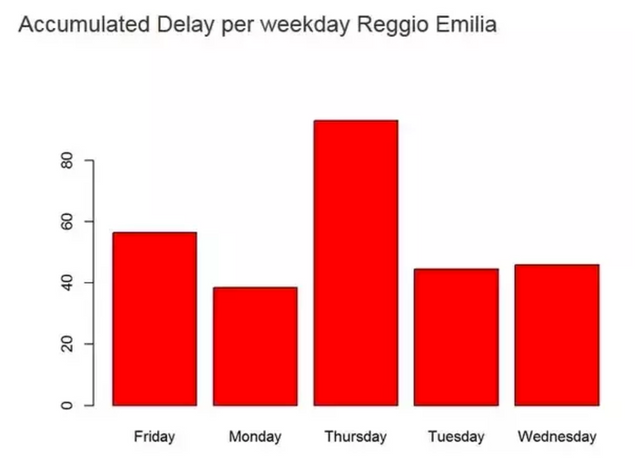
In the same way I aggregated the delays on the work days for the Reggio Emilia station.

Looking carefully to the graphics it seems to me that a pattern of delay emerges. For both the stations there is a higher total delay on Thursday while for the Reggio Emilia station there is also Friday to consider.
Going further with the analysis and aggregating the data for each hour of the day I discovered which trains are those that tend to get delayed more frequently.
Knowing this information helped me adjust myself by organizing my day as a commuter accordingly.
As for the strikes I try to read the press and get informed.
Edit: there is a great example of visualizing train data (Boston subway system) Visualizing MBTA Data (http://mbtaviz.github.io/)
The original source of this post was written first on Quora and I'm the author of it. You can find it here https://www.quora.com/Can-you-give-an-example-in-which-you-used-statistics-for-solving-a-real-problem/answer/Alket-Cecaj?srid=n9bS
@OriginalWorks please check my original contribution here.
Downvoting a post can decrease pending rewards and make it less visible. Common reasons:
Submit
The @OriginalWorks bot has determined this post by @alketcecaj to be original material and upvoted it!
To call @OriginalWorks, simply reply to any post with @originalworks or !originalworks in your message!
To nominate this post for the daily RESTEEM contest, upvote this comment! The user with the most upvotes on their @OriginalWorks comment will win!
For more information, Click Here!
Downvoting a post can decrease pending rewards and make it less visible. Common reasons:
Submit