In the previous post, we introduced the concept of reversal patterns. Using the Japanese candlestick charting technique, let`s look deeper into several major reversal patterns.
Hammer and hanging man lines
Depending on where they appear in a trend, these can be bullish or bearish. When either one of these lines occurs in a downtrend, they signal that the downtrend will come to an end. In such a scenario, the line is labeled a hammer.
And when either one of these lines turns up after a rally, the prior move may be ending. This line is called a hanging man.
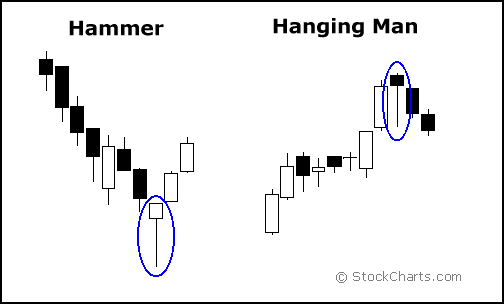
3 criteria can be distinguished with the hammer and the hanging man:
1. The real body is at the upper end of the trading range. The color of the real body is unimportant. 2. The long lower shadow should be twice the height of the real body. The longer the lower shadow, the more perfect the pattern will be. 3. There should be no, or a very short, upper shadow.
The longer the lower shadow, the shorter the upper shadow (preferably even none) and the smaller the real body the more meaningful the bullish hammer or bearish hanging man becomes. Although the real body of the hammer or hanging man can be white or black, it is considered more bullish if the real body of the hammer is white and slightly more bearish if the real body of the hanging man is black.The importance of bearish confirmation with the hanging man
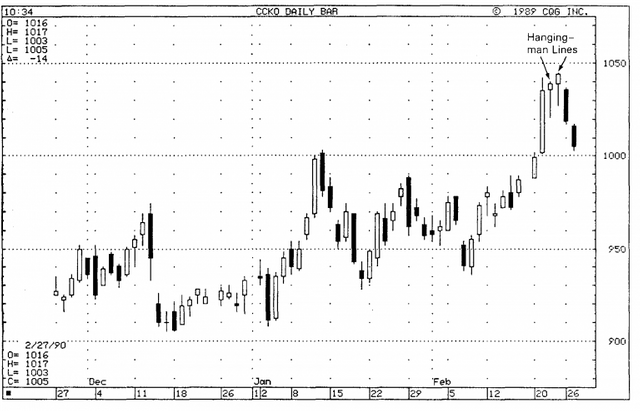
With the hanging man, it is very important to wait for bearish confirmation. The general principle goes as follows: the greater the down gap between the real body of the hanging man day and the opening price the next day, the more likely the hanging man will be a top.To illustrate the importance of bearish confirmation, have a look at the example chart below where you can identify 2 hanging man lines.
One indication of bearish confirmation would be for the next day's opening to be under the hanging man's real body. But after the appearance of the first hanging man, the market opened higher. After the second hanging man, however, the market opened under the hanging man's real body, and the market backed off.
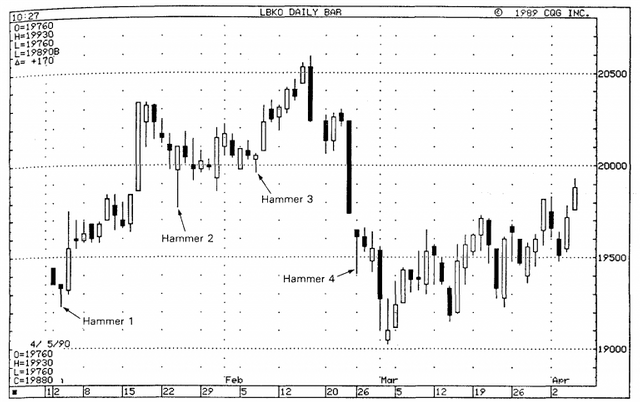
A downtrend is needed for a hammer to emerge
The hammers in the chart below must be viewed in the context of the prior price action. As a hammer is a bottom reversal pattern, one of the criteria for a hammer to appear, is that there should be a downtrend (even a minor one) in order for the hammers to reverse that trend.
Engulfing pattern
Most candlestick signals are actually based upon a combination of individual candlestick lines. An engulfing pattern is also considered a major reversal pattern with 2 opposite colored real bodies.
This is an example of a bullish engulfing pattern. The market is in a downtrend. A green bullish real body wraps around the previous red real body. This signals buying pressure has overrun selling pressure.
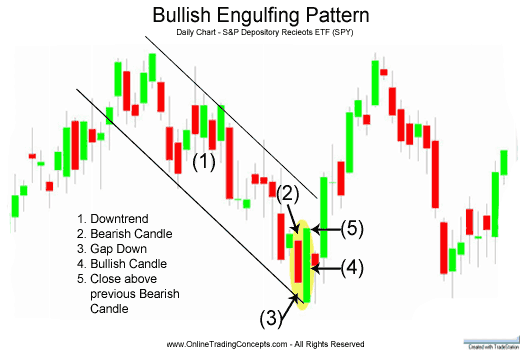
A bearish engulfing pattern is illustrated below. In this scenario, the market is trending higher. The white real body being engulfed by a black body indicates the signal for a top reversal.
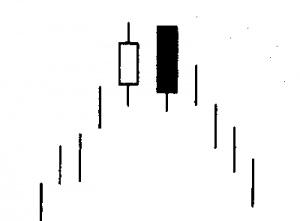
For an engulfing pattern 3 criteria are necessary:
1. The market has to be in a clear uptrend or downtrend, even if it is a short-term trend. 2. Two candlesticks include the engulfing pattern. The second real body must engulf the prior real body (but it doesn`t need to engulf the shadows). 3. The second real body of the engulfing pattern should be the opposite color of the first real body. (An exception to this rule is if the first real body of the engulfing pattern is so small that it is almost a doji, or is a doji. More information on the doji pattern will be provided in another article.)
Signs that strengthen the engulfing pattern as a reversal indicator
Some factors that increase the likelihood of an engulfing pattern to be an important reversal indicator would be as follows:
1. On the first day of the engulfing pattern there is a very small real body and on the second day, a very long real body is formed. This would reflect a break of the prior trend's force and an increase in force behind the new move. 2. If the engulfing pattern manifests after a very fast move. In this case, there may be less new longs in order to keep the market moving up. A fast move makes the market vulnerable to your HitBTC profit-taking. 3. When on the second day of the engulfing pattern more than one real body is engulfed.
In our next post, we will discuss more major reversal patterns, like the dark cloud cover and the piercing pattern.Source: Japanese Candlestick Charting Techniques (by Steve Nison)
Posted from my blog with SteemPress : http://companywebsolutions.com/japanese-candlestick-charting-on-hitbtc-major-reversal-patterns-part-1/