Stars form another group of significant reversal patterns
A star is a small real body that gaps away from the preceding large real body. It is still considered a star as long as the star's real body does not overlap the prior real body. The color of the star is unimportant. They can occur at tops or at bottoms.
The appearance of a star after a long white candlestick in an uptrend is a signal of a shift from the buyers being in control to a deadlock between the buyers and the sellers. When a star follows a long black candlestick in a downtrend, it reflects a change in the HitBTC market environment.
In Japanese candlestick charting, stars are part of four reversal patterns: the evening star, the morning star, the doji star and the shooting star.
The morning star as a bottom reversal pattern
This is a bottom reversal pattern, which forecasts higher prices. It is comprised of a tall, black real body followed by a small real body which gaps lower (these 2 lines make up a basic star pattern). The third day is a white real body that moves well within the first period's black real body. The market is in a downtrend when a black real body appears. At this time the bears are still in command. But then a small real body appears. This means sellers are losing the capacity to drive the market lower. On the next day, the strong white real body proves that the bulls have seized control.
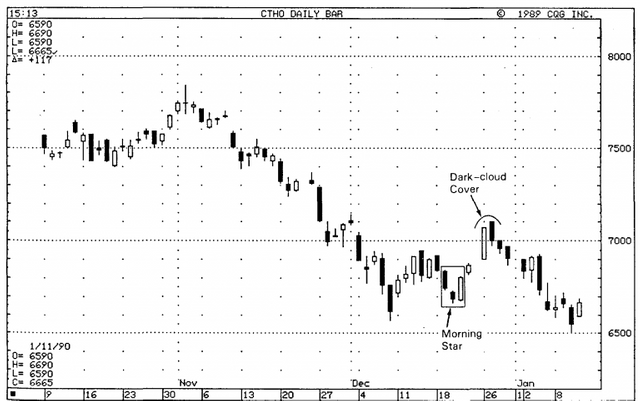
Example of a chart with a morning star
The evening star
This forms the bearish counterpart of the morning star pattern. Since the evening star is a top reversal, it arises after an uptrend. 3 lines compose the evening star (see example below). The first 2 lines are a long, white real body followed by a star. The star is the first hint of a top. The third line confirms a top and completes the 3-line pattern of the evening star. The third line is a black real body that moves sharply into the first period's white real body.
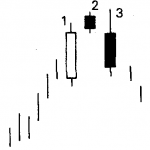
Evening star
Morning and evening doji stars can appear in an uptrend and in a downtrend
When a doji gaps above a real body in a rising market, or gaps under a real body in a falling market, that doji is called a doji star.
Doji stars are a potent warning that the prior trend is about to change. The session after the doji should confirm the trend reversal. A doji star in an uptrend followed by a long, black real body that closed well into the white real body confirms a top reversal. This pattern is named an evening doji star.
An evening doji star is a distinctive form of the regular evening star. The regular evening star pattern has a small real body as its star (this is the second candlestick), but the evening doji star has a doji as a star. The evening doji star is more important because it contains a doji.
Wait for confirmation with doji stars
A doji star during an uptrend is often the sign of an impending top. An important note, however, if the session after the doji star is a white candlestick which gaps higher, the bearish nature of the doji star is abolished.
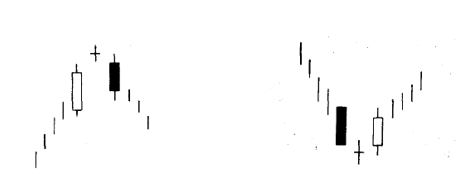
Evening doji star Morning doji star
In a downtrend, if there is a black real body, followed by a doji star, confirmation of a bottom reversal occurs if the next session has a strong, white candlestick that closed well into the black real body. This 3 candlestick pattern is called a morning doji star.
But the potential bullish implications of the doji star are voided if, during a downtrend, a black candlestick gaps under the doji star. So with doji stars, it is important to wait for confirmation in the next session or two.
The following example is still named a star although the shadow of the doji star bottom overlaps the prior day's black real body. When the white real body showed up after the star, confirmation of the downturn was over.
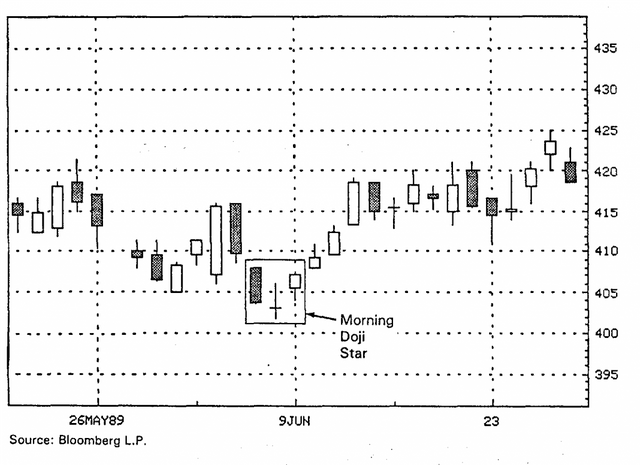
Example of a chart with a morning doji star
The shooting star and the inverted hammer
A shooting star is a 2-line pattern which sends a warning of an impending top. In Japanese candlestick charting, this is usually not considered a major reversal signal as is the evening star.
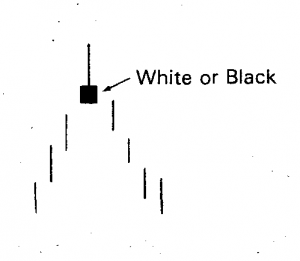
Shooting star
The shooting star has a small real body at the lower end of its range with a long upper shadow. The color of the real body is not important, as with all stars.
A shooting star-shaped candlestick after a downturn could be a bullish signal. Such a pattern is called an inverted hammer. While not a real star pattern, it does resemble a shooting star. An inverted hammer looks like a shooting star with its long upper shadow and small real body at the lower end of the range. But, while the shooting star is a top reversal line, the inverted hammer is a bottom reversal line. Similar to the regular hammer, the inverted hammer is a bullish pattern after a downtrend.
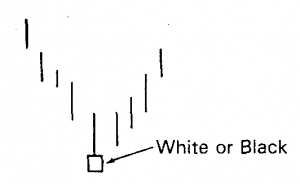
Inverted hammer
Next time we will explore a bit more about similarities between Western and Japanese charting patterns.
Source: Japanese Candlestick Charting Techniques (by Steve Nison)
Posted from my blog with SteemPress : http://companywebsolutions.com/japanese-candlestick-charting-stars-as-reversal-patterns/