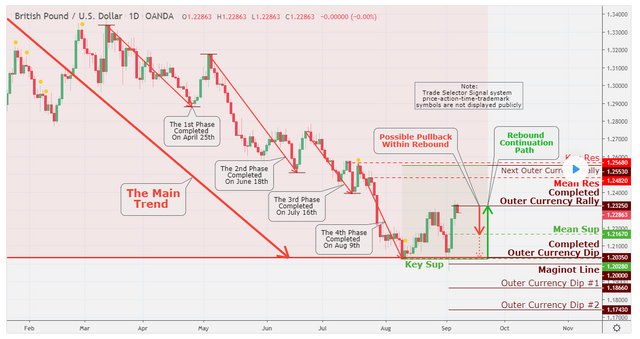
Technical Analysis and Outlook
The Sterling now is having upside momentum on the daily chart as the GBP/USD pair remains slightly below the completed Outer Currency Rally line. Initial resistance awaits at later part of July's generated Mean Res $1.2482. It is followed by Key Res $1.2568.
On the downside, initial support which capped the pair on September 5 is Mean Sup $1.2167. Further down, we have Key Sup, completed Outer Currency Dip and Maginot Line, which held the currency down in mid-August. To continue the rest of the story.
Congratulations @shaismithu! You have completed the following achievement on the Steem blockchain and have been rewarded with new badge(s) :
You can view your badges on your Steem Board and compare to others on the Steem Ranking
If you no longer want to receive notifications, reply to this comment with the word
STOPVote for @Steemitboard as a witness to get one more award and increased upvotes!
Downvoting a post can decrease pending rewards and make it less visible. Common reasons:
Submit