We're all aware of big data - the ever expanding collection of data points around us.
The data dump piles up daily.
From the tens of thousands of photographs we have to social media postings, from smart meters monitoring electricity usage to databases full of supply chain variables - the amount of stuff around us just keeps increasing.
Which creates new business models and opportunities for old and new firms.
In a working paper published by the University of Cambridge, Josh Brownlow, Mohamed Zaki, Andy Neely, and Florian Urmetzer put forward a framework to think about data driven business models.
They suggested that we need to ask ourselves six questions:
- What do we want to achieve?
- What is our offer?
- What data do we need and how are we going to get it?
- How are we going to process and use the data?
- Where is the money?
- What's in our way?
The team also put forward a taxonomy to help classify data-driven business models.
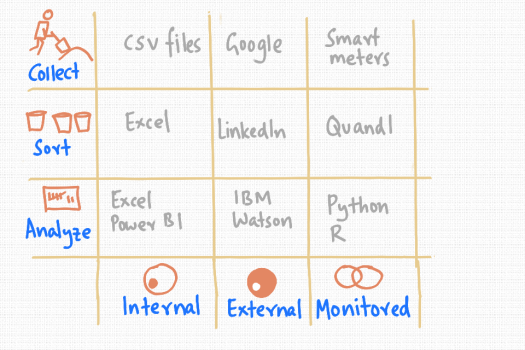
An adapted form of this is shown in the picture above, to help see what products, organisations and solutions are already in this space.
So, data comes from broadly three places.
Internal data is generated by individuals and companies.
External data is broadly everything that we haven't created.
Monitored data is collected and processed in a planned way - like website analytics or electricity metering data.
With data - we need to do three things to turn it into insight and decision support material.
We need to collect it, sort it in some way and then analyze it.
This classification system gives us a way to start thinking about business models in this space.
Also, clearly, models will overlap and some firms will do more than one thing.
So, for example, lots of data sits in comma separated value (csv) files. While we'd like to think databases are everywhere, the csv format is still very useful.
Many companies rely on Microsoft Excel to process their data - most people know how to use it after all.
The gorilla in the room when it comes to collecting information that is out there is Google.
On the other hand, when we want to find someone in business, LinkedIn is probably the place to go. It's sorted everyone's professional information rather well.
Now, lets say we want to analyze twitter feeds - IBM's Watson has a suite of services that might allow us to do that.
Then there is the data we collect on purpose.
Like electricity smart metering - that's rolling out in households in the UK - which is 20 million more places to read data from.
When it comes to market price data of all kinds, Quandl provides a convenient way to pick up feeds.
Finally, to analyze all this data, tools like Python and R come into their own - as scripting languages that can cope with the size and complexity of analytical needs.
So, the next time we're thinking of a data-as-a-service type opportunity, this classification may be a useful one to keep in mind.
Read more posts at Karthik-Suresh.com or connect with me on LinkedIn.
Congratulations @karthiksuresh! You have completed some achievement on Steemit and have been rewarded with new badge(s) :
Click on any badge to view your own Board of Honor on SteemitBoard.
For more information about SteemitBoard, click here
If you no longer want to receive notifications, reply to this comment with the word
STOPDownvoting a post can decrease pending rewards and make it less visible. Common reasons:
Submit