
A couple of weeks ago I began to read Uncle Bob's old developer bible: Clean Code. I was excited about the presented concepts and put a lot of thought into applying them into code. One day I was lying on the couch of our office, reading Chapter 2: Meaningful Names. Meanwhile, I overheard our team discussing the best troll name for a new database. Another day, I was reading the next chapter. Chapter 3: Functions should be small and do one thing only. Back at my desk, I found myself scrolling through functions with hundreds of lines of code.
Although most teams I know try to produce clean code, it seems to be a hard thing to keep a project clean while it grows. I began to wonder: How much clean code is really out there in the wild? Followed by: How can a project even be considered as clean? So I picked some famous open source projects and analyzed them!
What makes a project clean?
First, let's summarize what I did: My first intent was to check a static code analysis tool like SonarQube, but I could hardly find an open-source project which also published the results of such tooling. This is when Metrilyzer was born. An analysis tool of mine (private projects again^^) which can read almost every Java-based project to do some data analysis on it. At first, I focused on the following metrics:
- Classes per package
- Lines per class
- Methods per class
- Lines per method
- Parameter per method
Of course, they are not enough to consider a project as "cleanly coded" but in my opinion they give a good indication on code modularity and compliance with single responsibility principle. This is one of the hardest things to accomplish from my point of view. So using these metrics you can at least see clearly when a project is not clean coded. ;) Here are the results.
Cassandra, ElasticSearch, Spring Boot - The hard figures
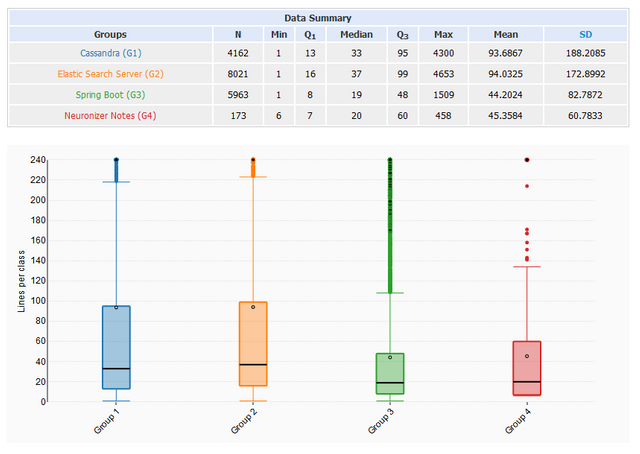
The four tested projects are Cassandra 3.11, ElasticSearch 6.5, Spring Boot 2.1 and Neuronizer Notes (an Android app of mine). In the boxplots you can see the number of lines per class (y-axis) per project (x-axis). N is the number of classes in the project (which could be analyzed by Metrilyzer). The maximum values are somehow obscured so that the rest of the plot looks better, but you can still read them in the table. If you don't know how boxplots work look here: What a Boxplot Can Tell You about a Statistical Data Set
You can see that most of the classes are very small and more than 75% of all classes are smaller than 100 lines of code. Despite every project having a couple of huge classes. It seems like the bigger the project, the longer the longest class is. Not very surprising, but things get more interesting when you compare different metrics. Let's take a look at lines per method for example:
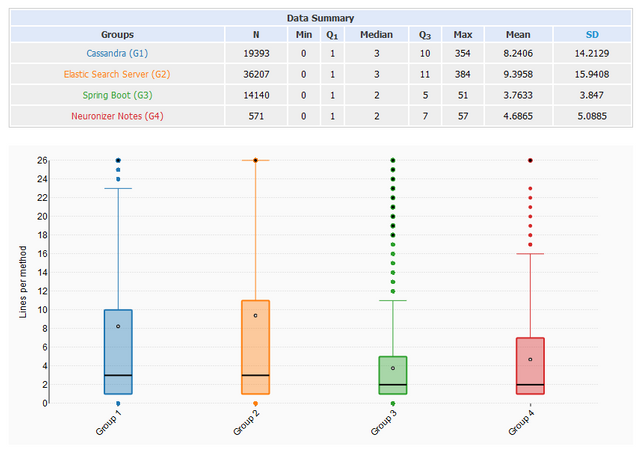
Like the classes, most of the methods are very small and more than 75% are smaller than 15 lines per method. Despite a large number of methods Spring Boot does a very good job at keeping them small. With a maximum of 54 lines per method. Also interesting is the correlation between N in the two metrics (which is the average number of methods per class):
- Cassandra: 19393 methods in 4162 classes = 4,65 methods per class
- Elastic Search: 36027 methods in 8021 classes = 4,51 methods per class
- Spring Boot: 14140 methods in 5963 classes = 2,37 methods per class
- Neuronizer Notes: 571 methods in 173 classes = 3,30 methods per class
I have to mention that getter and setter methods are excluded so in reality, the numbers are slightly higher (see metrics at the end). Neuronizer which is a small application has an easy time at keeping classes and methods small. As you can see Cassandra and Elastic Search do have a harder time. But Spring Boot is doing very well in comparison to the others. They have even smaller methods than my little android app. Okay, now let's take a look at the most problematic classes.
Pinning down problems
What you can see here are the five most biggest classes for each project.
| Lines per class | |
| Cassandra | org.apache.cassandra.service.StorageService: 4300 org.apache.cassandra.cql3.validation.operations.SelectTest: 2427 org.apache.cassandra.service.StorageProxy: 2244 org.apache.cassandra.db.LegacyLayout: 2160 org.apache.cassandra.db.ColumnFamilyStore: 2136 |
| Elastic Search | org.elasticsearch.index.engine.InternalEngineTests: 4653 org.elasticsearch.index.translog.TranslogTests: 2804 org.elasticsearch.index.shard.IndexShardTests: 2652 org.elasticsearch.index.engine.InternalEngine: 2631 org.elasticsearch.index.shard.IndexShard: 2566 |
| Spring Boot | org.springframework.boot.context.properties.ConfigurationPropertiesTests: 1509 org.springframework.boot.test.json.JsonContentAssert: 1277 org.springframework.boot.SpringApplicationTests: 1269 org.springframework.boot.SpringApplication: 1267 org.springframework.boot.test.web.client.TestRestTemplate: 1234 |
| Neuronizer | de.djuelg.neuronizer.presentation.ui.fragments.TodoListFragment: 458 de.djuelg.neuronizer.presentation.ui.fragments.PreviewFragment: 285 de.djuelg.neuronizer.presentation.ui.fragments.ItemFragment: 251 de.djuelg.neuronizer.storage.TodoListRepositoryImpl: 248 de.djuelg.neuronizer.storage.TodoListRepositoryImplTest: 214 |
What I recognized at first were the test classes. Since the teams out there (at least those I have been part of) care less about test code quality vs. productive code quality it makes sense they can get very long. You can also see that long classes lead to long test classes. Elastics InternalEngine and InternalEngineTests for example. As test classes grow it gets harder and harder to keep them maintainable, so a well thought-out model for test classes should be applied. Regarding large test classes, I can recommend the article Writing Clean Tests – Small Is Beautiful.
Another important thing you can learn from this table is where the application has not been modeled carefully. Cassandras StorageService, for example, has a very generic name and became the biggest god class in the project. Elastics Engine and InternalEngine had a similar destiny. These classes could easily be separated in a couple of subclasses, but as they are now they just cannot be clean.
For the interested guys out there, here are the other metrics in an uncommented form. They will be mentioned in the Conclusion though. All visualizations have been done using goodcalculators.com.
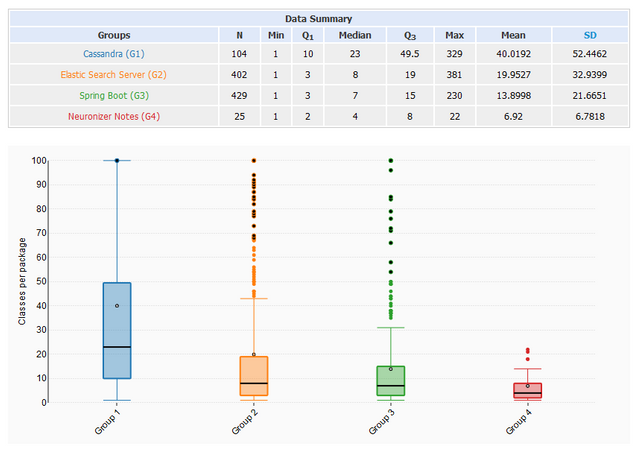
Classes per package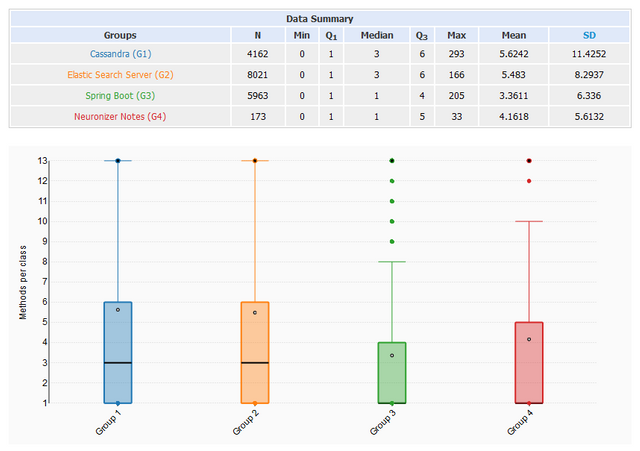 Methods per class
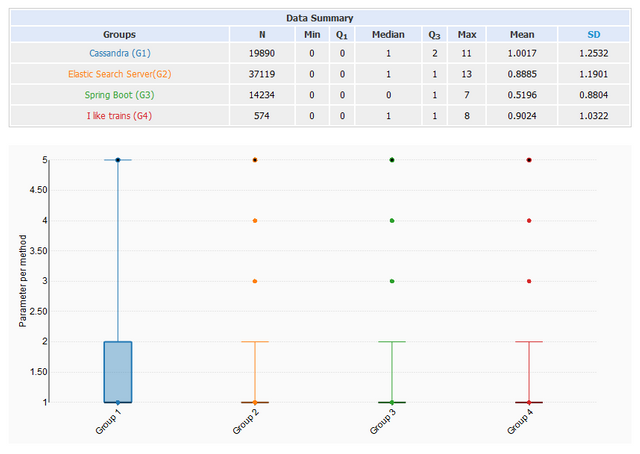 Parameter per method
Conclusion
Probably, you already thought in the beginning: You can't put hard figures on the rules of Clean Code like "Oh boy, this class here is 5 lines too long! Are you dumb?" But you can use these metrics as an orientation. You can aim for the Pareto principle. For example: Refactor the highest 20% of each metric. Try to be in the lower 80% with all your new code. When you reach 100 lines of code in a class, for example, there could be better ways to modularize that piece of code. Here are the 80% boundaries for each metric (based on all analyzed projects):
- 80% of all classes are smaller than 100 lines
- 80% of all methods are smaller than 12 lines
- 80% of all packages have less than 25 classes
- 80% of all classes have less than 8 methods
- 80% of all methods have less than 3 parameter
Despite this being a rather shallow analysis on the topic of clean code, the results were quite interesting. Using Metrilyzer on a single project with tailored visualizations can be even more helpful to improve modularity and to locate trouble spots. Maybe you want to give it a try to analyze your own projects. If so, I would be glad to hear from you :)
Greets, Domi
Posted from my blog with SteemPress : http://craftcodecrew.com/clean-code-the-hard-facts-and-figures/