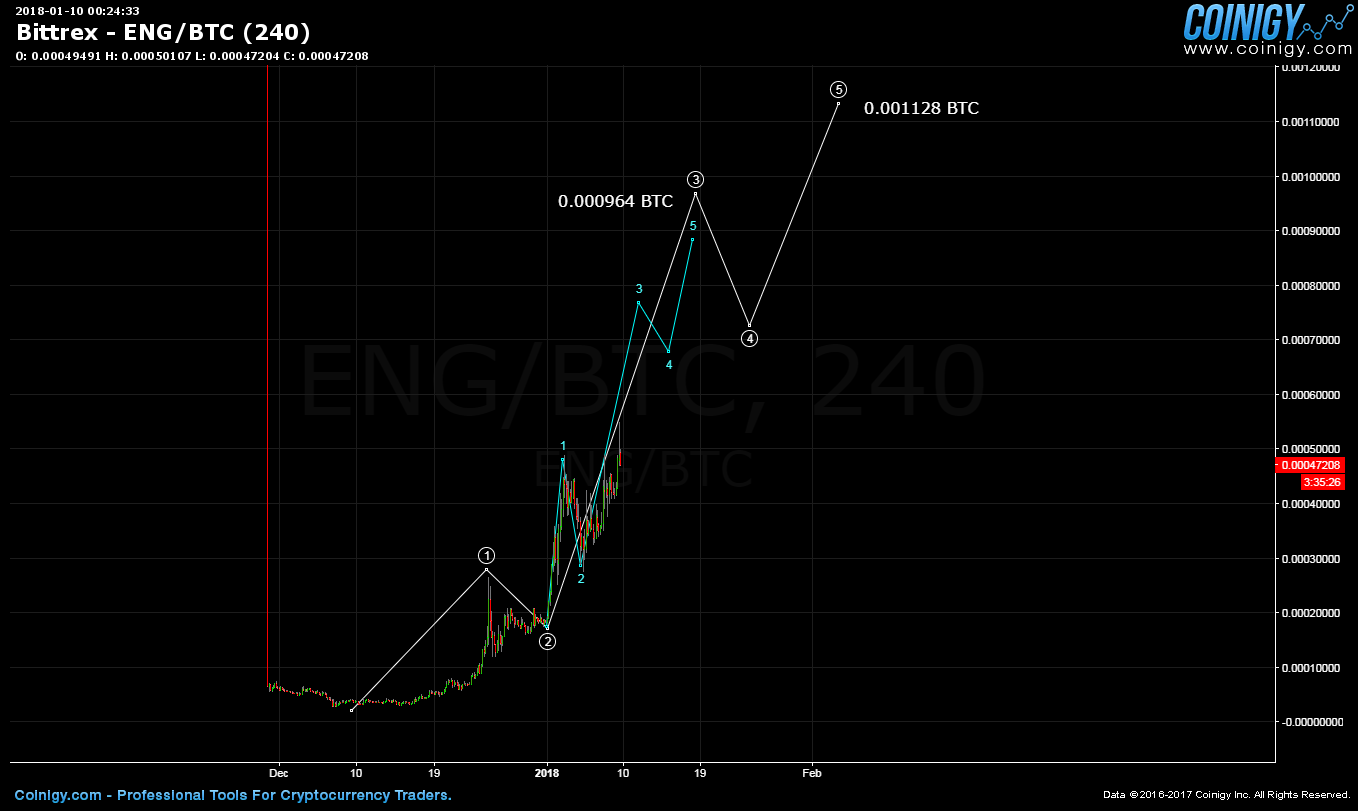
Once a bottom is found, the original trend resumes and this can be measured using Elliott Waves and Fibonacci ratios. The below chart depicts a rounded bottom pattern which is quite common for correctional bottoms. Once wave 1 is established, it ca heavily be used as a reference to delineate the remaining waves. The waves 3 and 5 are placed per Fibonacci ratios to wave 1 and the target can be identified as 0.001128 BTC. I've added the subwaves of wave 3 which targets 0.000964 BTC.

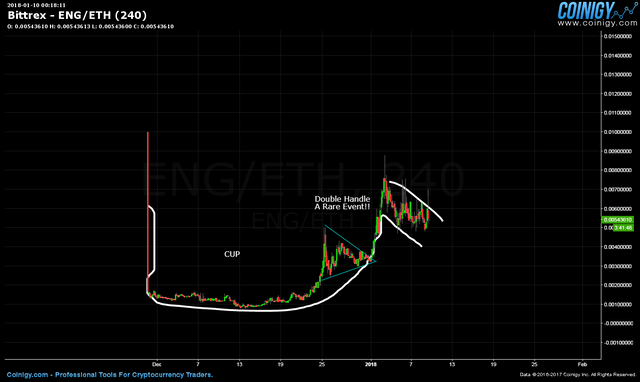
Here is the ENG/ETH. A rare event to identify a double handle pattern and it has been in the cryptos where such unusuals have been identified. Cryptos are quite different in personality than stocks as they adhere beautifully to the directions of sentiment.

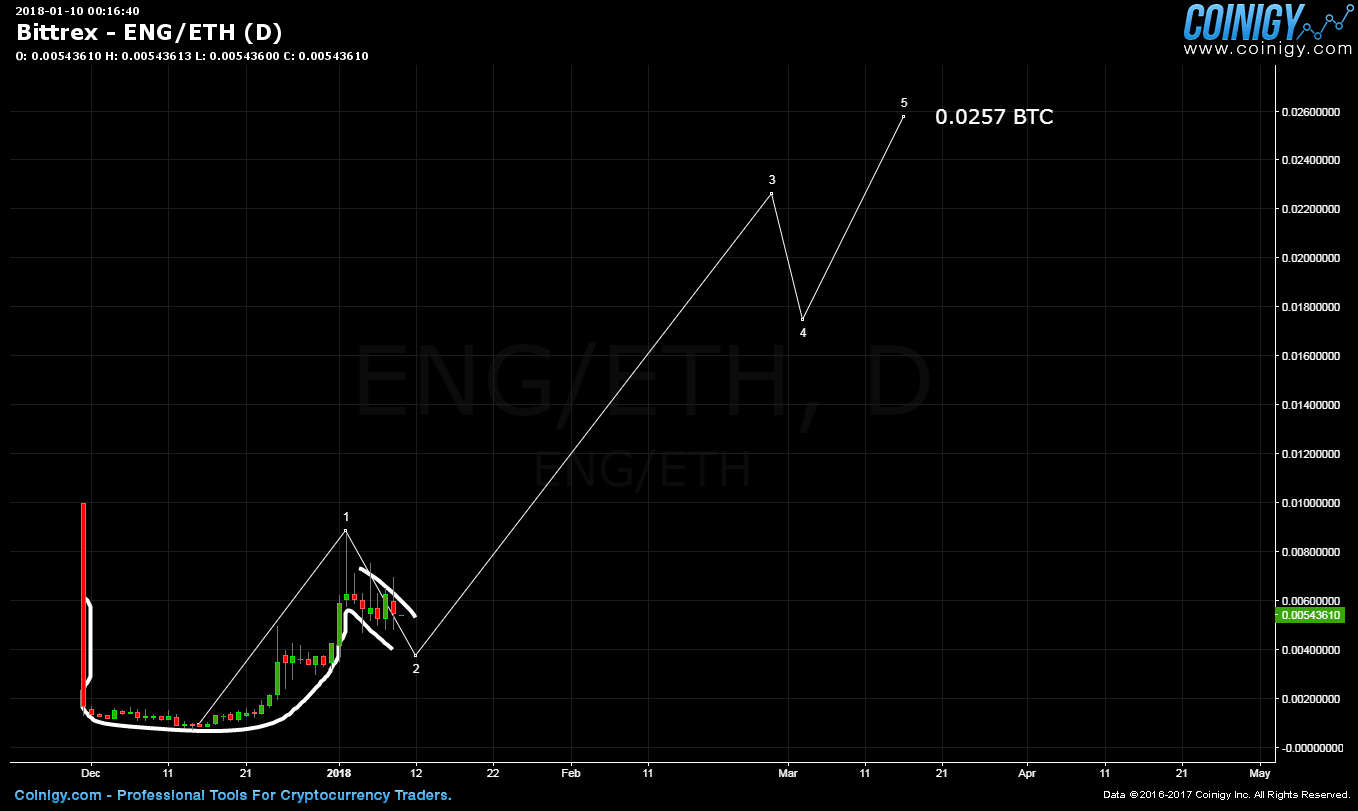
The higher degree of trend for ENG/ETH shows a target of 0.0257 ETH. There is a typo in the chart, it should show it as ETH and not BTC target.

If this blog post has entertained or helped you to profit, please follow, upvote, resteem and/or consider buying me a beer:
DGB Wallet : DBhHhG7fnJivxcjiqv2PsyStkNo9sPVcC5
XVG Wallet : D5u4PvxbgsicNPPFk3k7n8Qi11kE7dND69
DOGE Wallet : DHjFZFQduuAjj3NLvMmn6SF1FHN3kvmzLH
Authors get paid when people like you upvote their post.
If you enjoyed what you read here, create your account today and start earning FREE STEEM!
If you enjoyed what you read here, create your account today and start earning FREE STEEM!