#Bitcoin #price is trading below the $ 57,500 resistance against the US dollar.

Bitcoin price is trading below the $ 57,500 resistance against the US dollar. If there is a clear break below the $ 53,500 support zone, #BTC is likely to initiate a major drop. According to the technical analysis of NewsBTC's Aayush Jindal:
🔥Bitcoin is struggling to gain momentum above the $ 56,000 and $ 56,500 levels.
➡️The price is currently trading well below $ 56,500 and the 100 hourly simple moving average.
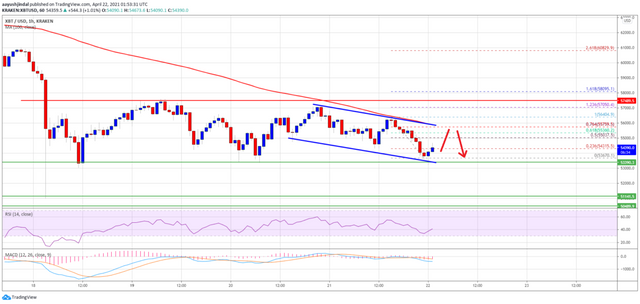
➡️There is a new bearish channel with resistance around $ 55,750 on the hourly chart of the BTC / USD pair ( based on Kraken data).
➡️The pair could rise further, but the bulls will likely struggle around $ 55,750 and $ 56,500.
Bitcoin (BTC) Price At Risk
Bitcoin recovered above the $ 56,000 level, but the bulls could not get stronger. BTC peaked near the $ 56,400 level and failed to clear the 100 hourly simple moving average.
It rose to around $ 56,404 and the price continued to decline. It broke the $ 55,400 support and revisited the $ 53,500 support zone. It dropped as low as around $ 53,650 and the price is currently consolidating losses. Instant resistance is near the $ 55,050 level.
The 50% Fib retracement level of the last drop from $ 56,404 to $ 53,670 is also near $ 55,050. The next major resistance is near the $ 55,400 level.
Moreover, there is a new bearish channel with resistance near $ 55,750 on the hourly chart of the BTC / USD pair. Channel resistance is near the 76.4% Fib retracement level of the last drop from $ 56,404 to $ 53,670.

Above the channel resistance, the main range resistance is near the $ 57,500 level. A successful break above the channel resistance followed by a continuation above $ 57,500 is essential to start a new uptrend.
🔥Will Bitcoin (BTC) Fall?
If Bitcoin fails to cross the $ 55,050 and $ 55,500 resistance levels, it can make further corrections. Instant support on the downside is near the $ 54,000 level.
The first major support is near the $ 53,500 level and the channel's lower trend line. Further losses would likely require a downside break towards the $ 51,000 and $ 50,000 levels.
🔥Technical Indicators
Hourly MACD - The MACD is slowly gaining momentum in the bearish zone.
Hourly RSI (Relative Strength Index) - The RSI for BTC / USD is currently below the 50 level.
Major Support Levels - $ 54,000 followed by $ 53,500.
Major Resistance Levels - $ 55,050, $ 55,500 and $ 56,500.