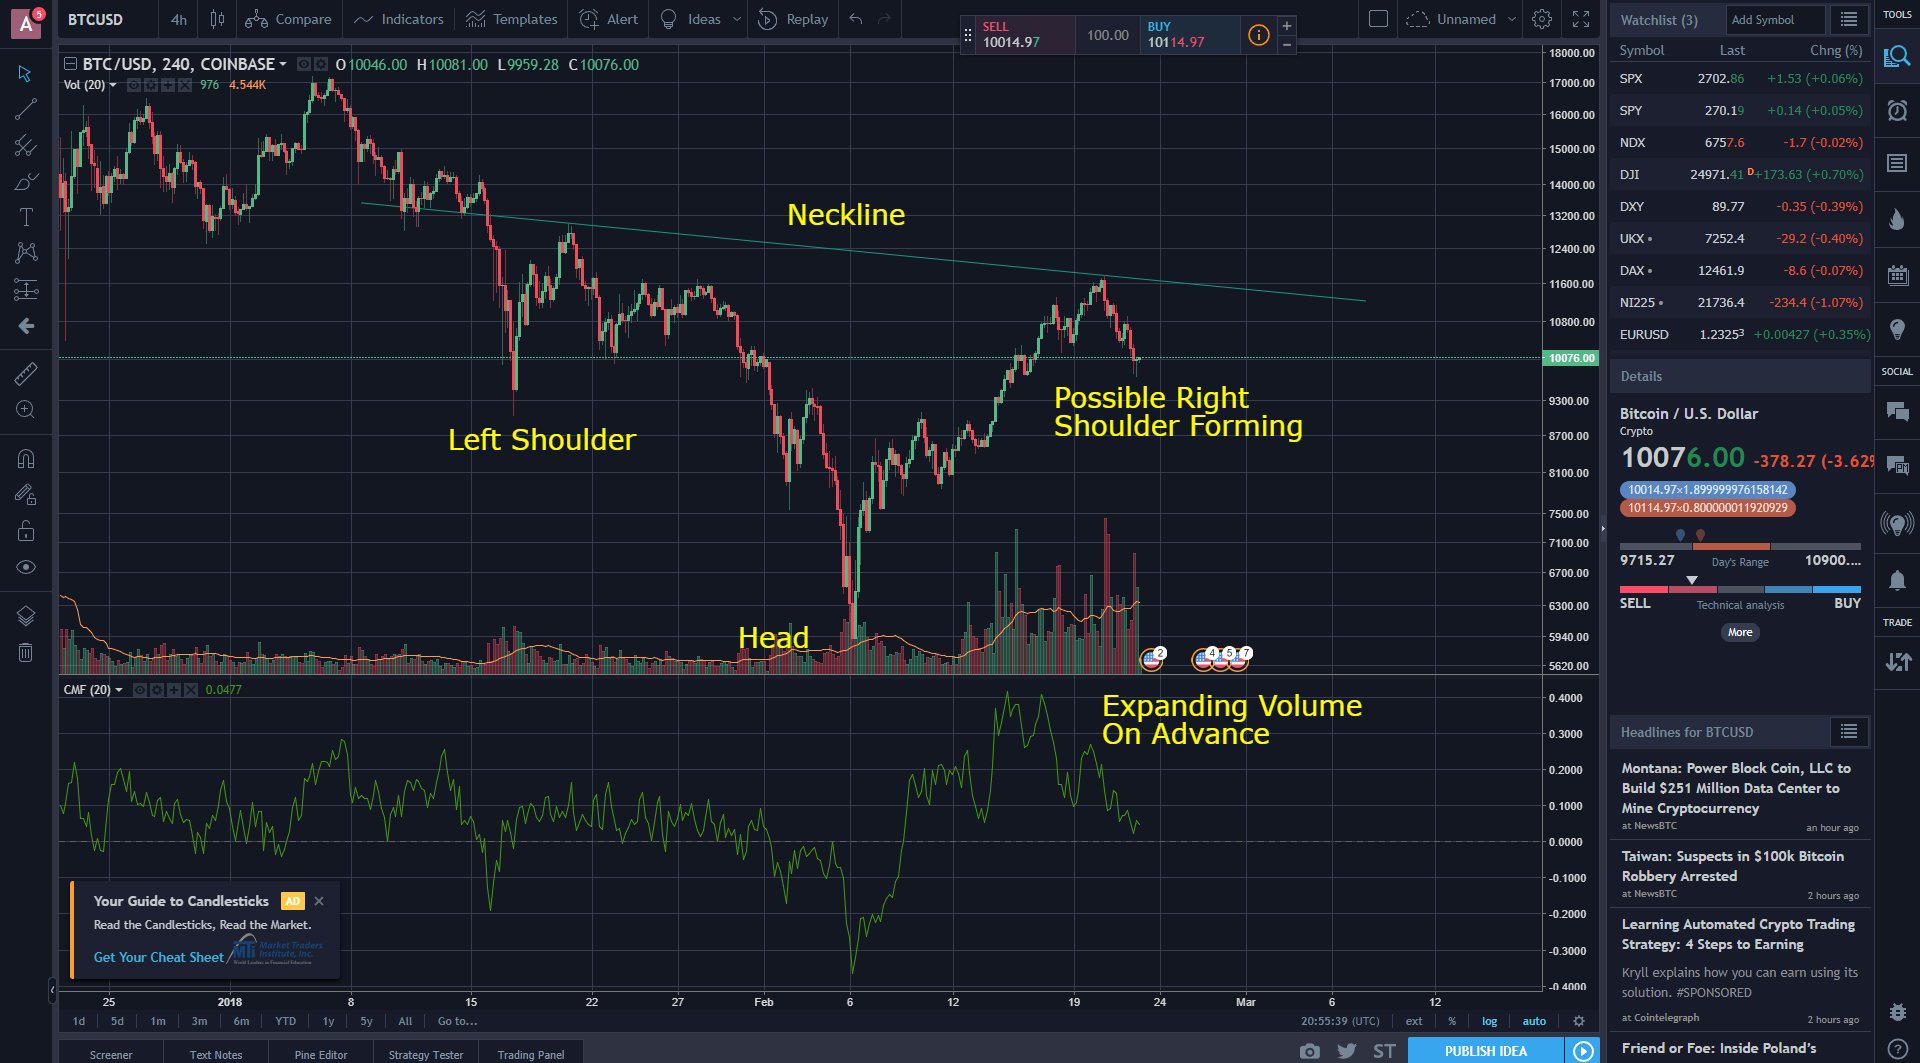
This is from a few days ago, and the pattern seems like it's continuing to form. Btc has come right up to the neckline, if it moves up from here on any volume we could see a strong move to $14k. Price target based on distance from neckline to the head of the inverse head and shoulder.
If you explain these terms to me so I don't have to research them, I'll give you two upvotes and a follow.
Downvoting a post can decrease pending rewards and make it less visible. Common reasons:
Submit
An inverse head and shoulders pattern is a pattern in a chart that signals the reversal of a downtrend and the beginning of a new upward trend. The neckline is a line drawn from the reaction high of the left shoulder to the reaction high of the right shoulder. If the price penetrates the neckline on high volume the pattern is confirmed. A price target is determined by taking the distance from the neckline to the bottom of the head. Add the value of the distance to the price at the neckline, and that's your price target.
I hope this explanation helps!
Check out this link for a more detailed explanation http://stockcharts.com/school/doku.php?id=chart_school:chart_analysis:chart_patterns:head_and_shoulders_bottom_reversal
Downvoting a post can decrease pending rewards and make it less visible. Common reasons:
Submit
Thanks for clarifying!
Downvoting a post can decrease pending rewards and make it less visible. Common reasons:
Submit
Thanks for reading! Hopefully we get a breakout in btc soon =)
Downvoting a post can decrease pending rewards and make it less visible. Common reasons:
Submit