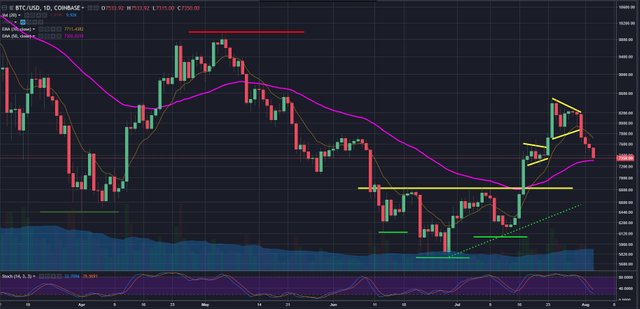
Hello Steemians! Since I wrote this post about 4 days back regarding the uptrend in BTC. The rally failed quite dramatically! Let us have a look at the BTC daily:
As I write this post today, BTC is currently trading at 7345. That is over $1000 down from the near-term high of 8400. More importantly it broke the second flag described in the previous post to the downside. Flags can always break in either direction and have no predicting power. But previous uptrend gives it at upward bias. Daily BTC chart still looks healthy, prices are holding at daily 50 EMA around 7300. A break below this will be concerning. However, previous neckline remains at 6850. So there are plenty of support below.
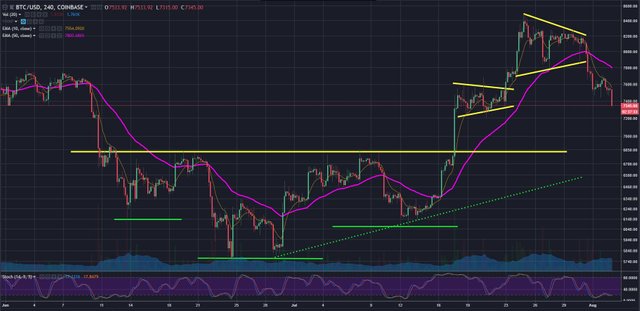
Recent price action is spectacular in the 4 hour chart above. Current levels are good holding ground and the 6850 neckline support is clearly visible, which I have marked with a yellow horizontal line. So these are the levels I am observing at the moment. We momentum traders take one bar at a time always.
Disclaimer: This is NOT professional advice, this is all just my own opinion and experience. I am NOT a Certified Financial Adviser. Consult professionals for any financial, accounting or legal related questions you have.
Charts are created in Tradingview.com, which is a free service


Thank you for your post. :) I have voted for you: 🎁! To call me just write @contentvoter in a comment.
Downvoting a post can decrease pending rewards and make it less visible. Common reasons:
Submit
Looks scary in the short term, but we all know where we're headed in the long term (fingers crossed).
Downvoting a post can decrease pending rewards and make it less visible. Common reasons:
Submit
Downvoting a post can decrease pending rewards and make it less visible. Common reasons:
Submit
Coins mentioned in post:
Downvoting a post can decrease pending rewards and make it less visible. Common reasons:
Submit