Economic uncertainty and Fed expectations keep investors on edge as Bitcoin searches for direction.
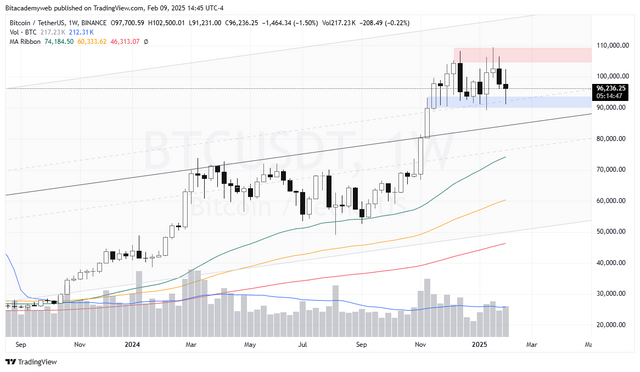
The price of Bitcoin remains at $96,235, showing a doji candle on the weekly chart, reflecting investors' indecision in the face of mixed economic data in the US. As the labor market and inflation generate uncertainty, traders analyze whether BTC will continue its upward trend, consolidate or correct in the coming weeks.

On the weekly chart, Bitcoin is at $96,235, showing a doji candle that indicates indecision in the market / Tradingview
Mixed economic data: How does it affect Bitcoin?
Labor market: Moderate growth but below expectations.
The latest Non Farm Payrolls (NFP) report showed the creation of 143,000 jobs, below the 170,000 expected. Although this indicates moderate growth, it suggests that the labor market is not as robust as anticipated. This data could lead the Federal Reserve (Fed) to take a more cautious stance regarding future interest rate hikes, which would weaken the dollar and benefit risk assets like Bitcoin.
Unemployment Rate: Slight Improvement but With Inflationary Risks
The unemployment rate stood at 4%, slightly better than 4.1% expected. A strong labor market could exert inflationary pressure, which would keep the Fed on alert. However, if other indicators show weakness, the dollar could lose strength, opening up space for a rally in cryptocurrencies.
Inflation Expectations: Concerns on the Rise
Five-year inflation expectations reached 3.3%, their highest level since July 2008. This suggests that consumers anticipate persistent inflationary pressures, which could lead the Fed to keep rates high for longer. Although Bitcoin is seen by some as a hedge against inflation, a high-rate environment could limit its growth in the short term.
Consumer Confidence: Significant Decline
The preliminary Michigan Consumer Sentiment Index fell to 67.8, below the expected 71.1. This decline reflects concerns about inflation and economic growth, which could weaken the dollar and increase the appeal of risk assets like Bitcoin.
Bitcoin on Charts: Consolidation and Possible Scenarios
On the weekly chart, Bitcoin is at $96,235, showing a doji candle that indicates indecision in the market. The leading cryptocurrency is in the overbought zone, well above the EMA50, suggesting the possibility of a correction or consolidation developing.
Key Resistance: $109,500
Key Support: $93,800
Since November 18, 2023, Bitcoin has been moving within this range, showing clear consolidation. Although the trading volume on Binance is slightly declining, the bullish sentiment prevails by holding above the EMA50, EMA100, and EMA200.
What to expect in the short and medium term?
Short-term: Investors will be keeping an eye on the upcoming US inflation data, which could define the direction of the market. A weaker dollar and a dovish Fed stance could push Bitcoin towards the $109,500 resistance.
Medium-term: If economic indicators continue to show weakness, Bitcoin could consolidate in its current range. However, a stagflation scenario (high inflation with low growth) could create volatility and put downward pressure.
Disclaimer: This analysis does not constitute financial advice. Cryptocurrencies are volatile assets; please do your own research before investing.
Upvoted! Thank you for supporting witness @jswit.
Downvoting a post can decrease pending rewards and make it less visible. Common reasons:
Submit