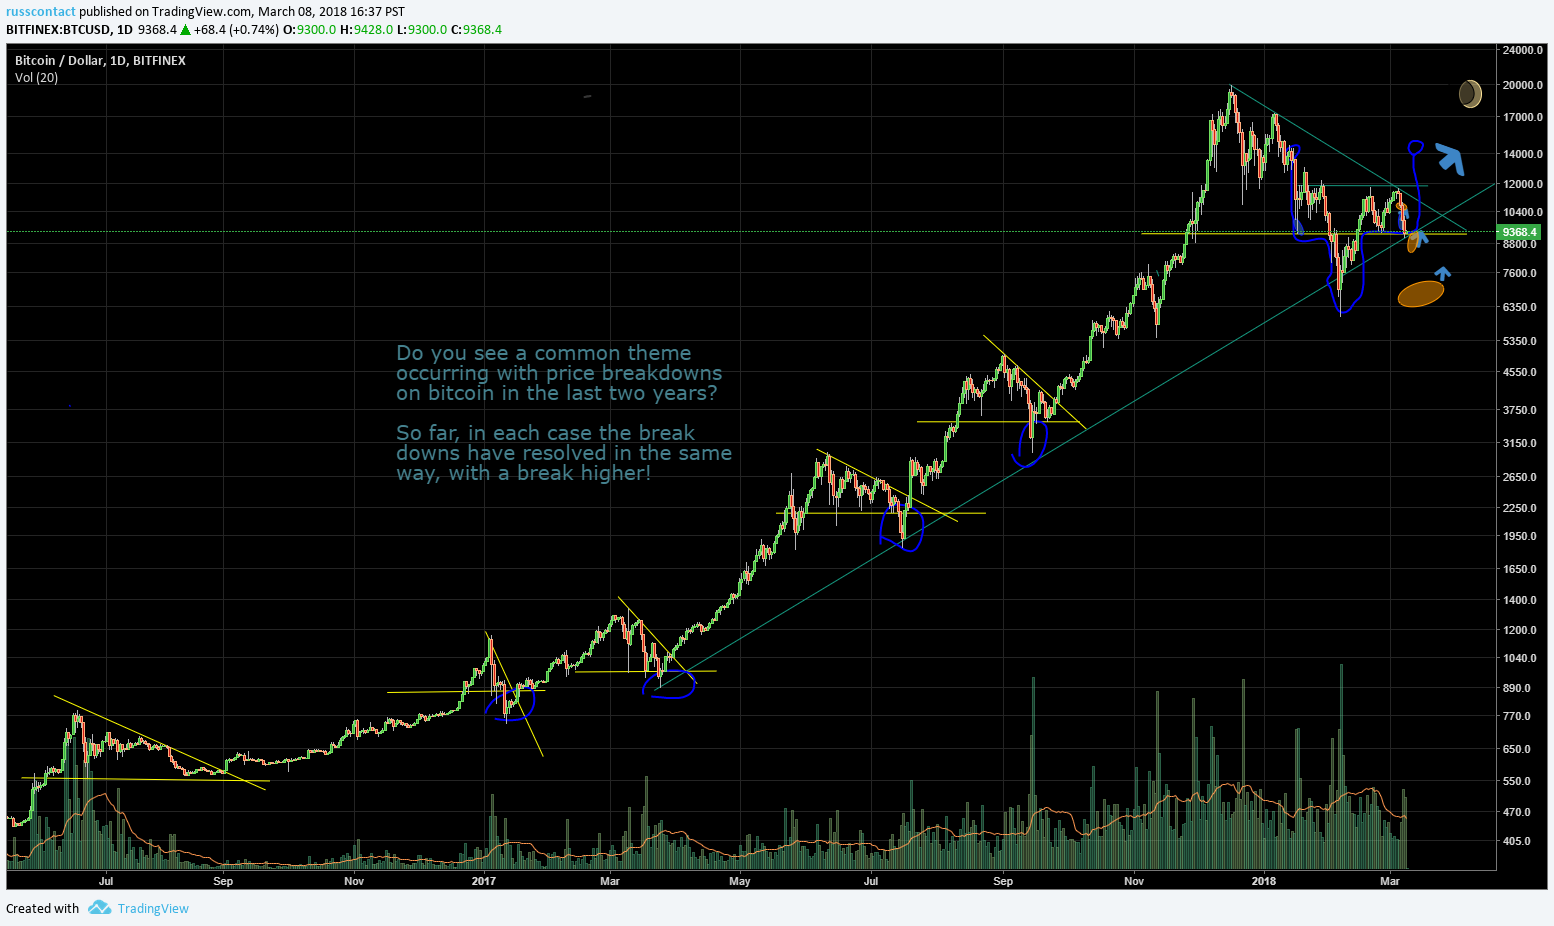
As you can see from the chart for the last two years Bitcoin has had many price breakdowns. From the logarithmic chart presented here you can see that all of the large draw downs for the past two years have in fact been bull flags. That is they are technical patterns preceding price breakouts to new highs.
This time could be the exception to the rule, or it could be the sixth bullish flag pattern for Bitcoin since June 2016.
Do your own research. I am not a professional financial adviser. Do not expect me to make decisions for you. Dig in and educate yourself or find a professional adviser before investing. Also in crypto, only invest what you can afford to loose.
It is so easy to fall negative emotions at times like this. Try to step away for a moment and take this eagle eye perspective with me.
I would like to cover more alt-coins, but in this environment everything is dependent on the price action of Bitcoin.
Kinda looks like the S&P 500s chart especially the most recent part of it.
Downvoting a post can decrease pending rewards and make it less visible. Common reasons:
Submit
Yes. I hope it does not follow the s&p down. I am not looking forward to another year like 2014. Many altcoins would not survive a year long recovery.
Downvoting a post can decrease pending rewards and make it less visible. Common reasons:
Submit