NOTE ABOUT BLOG
The blog is still in it's infancy and I ask that you guys give me feedback on analysts being reviewed, layout etc. I've removed "The Moon" and "Coin Mastery" as analysts. In my experience (following both of them for quite a while now), they're more geared towards macro trends in the BTC Market, which is not the main focus of the blog. We try and do the heavy lifting for you guys, to give you a concise systematic DAILY TA ANLAYSIS of the BTC market. You can find "The Moon" and "Coin Mastery" on Youtube, for those still interested in following them.


JD Marshall
Type of Trader: Medium/Long Term Trader
[Macro argument is that BTC is consolodating at these levels and building steam for higher highs in the FUTURE is still his macro perspective. In his opinion we're not seeing BTC reaching all time high any time soon. BTC next big resistance is the top of $9990. Since Feb. BTC's seen 3 major bottoms around the 6k-7k level. Which is an indication of forming higher lows and confirms a macro bullish trend (Green Line on Chart). Patience will be the key word for medium/long term investors in the BTC Market]
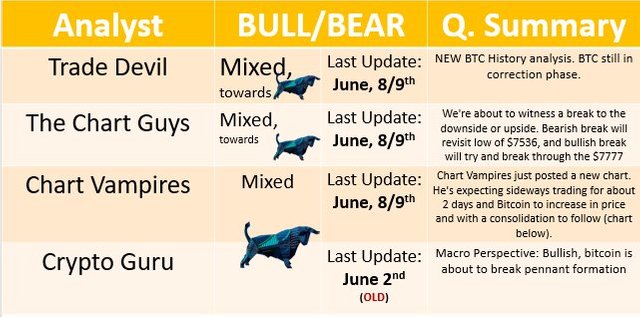
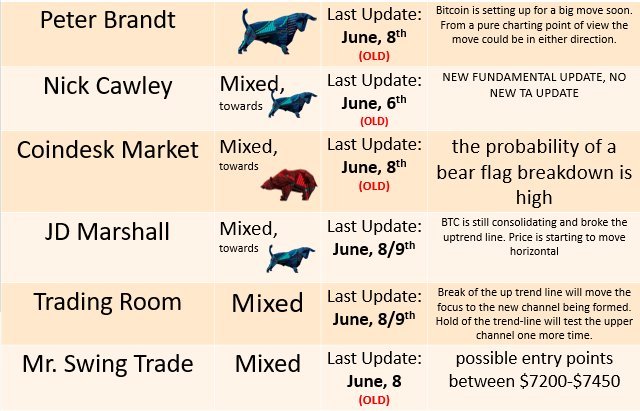
BTC is still consolidating and broke the uptrend line. Price is starting to move horizontal. Most of the weekend expect BTC to just trade horizontal. Keep an eye on the $6950 low. If that get's broken we're looking at prices in the lower $6000's. If BTC breaks out of the bottom (purple box), he doubts that we're going to break the recent high around $9k. James is till making the macro argument that BTC is building a base after bubble, and slowly building energy for higher prices in the future. Do not expect major moves in BTC in the short term.

@chartguys
Type of Trader: Short Term Trader
Some Macro Trend feedback: If BTC breaks down on the weekly chart, a lot of money will leave the space and big exchanges like Coinbase will feel start feeling the burn. Exchanges make their money of volatility, but if flat trading, like we saw on Thursday, becomes more common place (in the next few months), patience will be needed.
We're about to witness a break to the downside or upside. Bearish break will revisit low of $7536, and bullish break will try and break through the $7777 level and continuation from that level.
So far bullish reversal not confirmed on the Weekly candle. The bulls need to break $8000. To confirm the bullish equilibrium (higher highs, higher lows) pattern. A break is definitely coming. We might see a break during the weekend, as the trading range is tightening up and the volume is steady. Expect a break to the upside or downside.
MARKET is not favorable for trading at this stage. Very slow and not much is happening.
@tradedevil (NEW VIDEO WITH BTC HISTORICAL ANALYSIS)
Type of Trader: Short Term Trader/ Day Trader / E.W. Analyst
Looking at BTC's history and the correction pattern it's in, it's clear that BTC is far from finishing it's correction. The video is very informative, and help to give you the macro context of Bitcoin. The video ends with the following, which is quite a shocker for most bulls out there: "...so whether your a bull or bear, it doesn't matter what side your on, you have to acknowledge that the correction is far from over. When Moon? Not soon..."
chris L $ChartVampire$
Type of Trader: Short Term Trader/ Day Trader
Chart Vampires just posted a new chart. He's expecting sideways trading for about 2 days and Bitcoin to increase in price and with a consolidation to follow (chart below).
- Bull Target 1 is 60% possible from here and he will increase that to 70% possible Based on Daily close.

Peter Brandt (NO NEW UPDATE)
Type of Trader: Short/Medium Term Trader
Bitcoin is setting up for a big move soon. From a pure charting point of view the move could be in either direction. In fact, the burden of truth is on the bulls.

Nick Cawley (NO NEW UPDATE)
Type of Trader: Long Term Trader/Investor
(NEW FUNDAMENTALS ANALYSIS)
A look at Google analytics show that searches for Bitcoin (BTC), Ether (ETH), Ripple (XRP) and a range of other cryptocurrencies have fallen dramatically after the market slumped at the start of the 2018. While investor interest has fallen, the number of net-long retail customers remains near to all-time high levels, suggesting investors continue to hold positions despite lower prices. The Google trend data may suggest that investors looking for quick returns have moved on and that going forward the market will continue to mature. Recent trading ranges give credence to this with support levels holding, allowing the market to push gently higher.
GOOGLE TRENDS - BITCOIN

Trading Room
Type of Trader: Short Term Trader
Break of the up trend line will move the focus to the new channel being formed. Hold of the trend-line will test the upper channel one more time.

Crypto Guru (NO NEW UPDATE)
Type of Trader: Short Term Trader
Mini Falling Wedge (teal) within a Massive Wedge (yellow). We faced the same exact situation at the start of Feb & April; except this time he believe we're ready to break through the Massive Yellow Wedge.

Coindesk Markets (NO NEW UPDATE)
Type of Trader: Short Term Trader

The probability of a bear flag breakdown is high as BTC bulls have failed to capitalize on the upside break of the falling channel. Bulls need a quick break above $7,780.

BTC is breaking lower. The flag support is seen around $7,520.
Mr. Swing Trade (NO NEW UPDATE)
Type of Trader: Short Term Trader / Swing Trader
1)If he is to remain bullish, these are the zones he would keep an eye out to go long for intraday trading between the swing-low and swing-high pivot points.
- The highlighted ares in green is possible entry points between $7200-$7450 (on chart).

Also, a shout out to @famunger for his daily Analyst Summaries.