Please note : this is all opinion and should not be taken as financial advice.
Moving Averages (MA) are used to smooth out the noise in price movements. The use of crossovers of varying MAs can sometimes indicate a trend shift.
Today I was looking at various moving averages (MA) with Bitcoin. Have a look at these 3 comparisons with a 10 day MA.

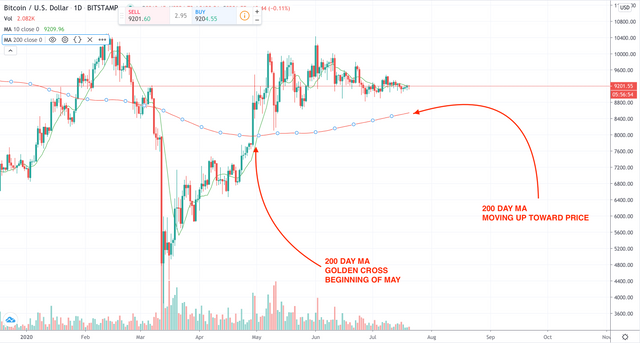
First, a 200 day MA with a 10 day MA. The last golden cross (buy signal) occurred at the beginning of May. Currently the 200 day MA is moving up closer to the 10 day, but no cross has occurred. This chart would indicate we're still in a buying period with the price trending up.

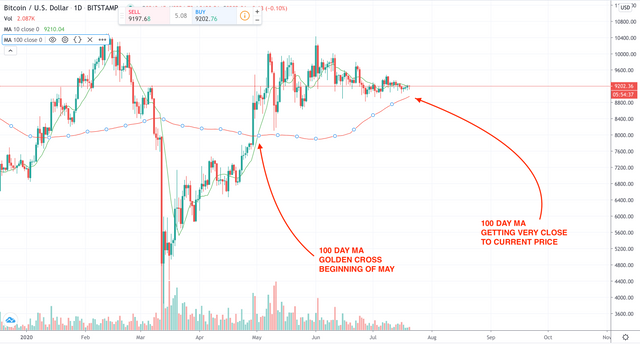
Next, a 100 day MA with a 10 day MA. The last golden cross (buy signal) occurred at the beginning of May, much like the 200 day MA. Compared to the 200 day MA, the 100 day MA is MUCH closer to the 10 day, but still no cross has occurred. This chart would indicate we're still slightly in a buying period but the trend could be shifting soon.

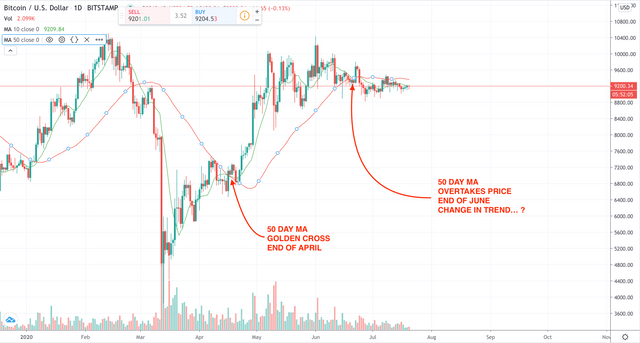
Finally, a 50 day MA with a 10 day MA. On this chart the last golden cross (buy signal) occurred at the end of April. A death cross crossover has occurred, indicating a trend has shifted downward and we've moved into a sell period. The tricky part here is the gap between the two MAs hasn't grown very wide, so even though the chart suggests a trend change I would be hesitant to sell but prepared for it soon.
Ultimately, the charts all suggest that the sideways movement will end with Bitcoin moving down. That said, things could change rather dramatically, I would recommend continuing to keep a close eye on BTC movements and MAs.
Best of luck to all traders!