Please note : this is all opinion and should not be taken as financial advice.
Bitcoin has been moving sideways for several weeks, months depending on how you volatile you judge the ups and downs to be that we've had since around the middle of May.
Moving averages can sometimes tell a story about how things are going and sometimes even before they happen.
One set of moving averages that is interesting to watch is the 10 day and 50 day MA.

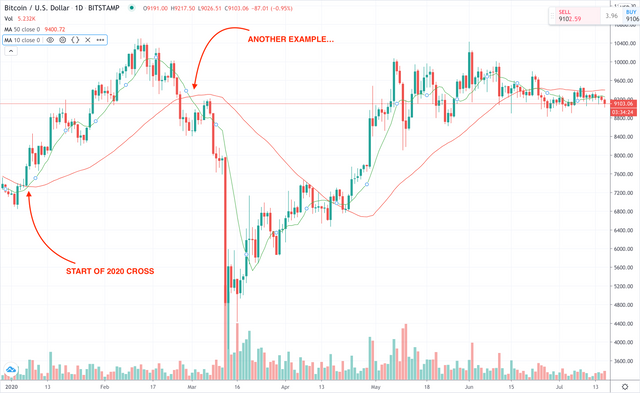
If we look at the beginning of the year as an example, trading based on these moving averages would have been very beneficial. Trades based on the crossing of these MA's would have seen buys at around $7300 and sells around $9300.
So, while no one should live and die by these moving averages they do seem to present some indication as to where things are going.

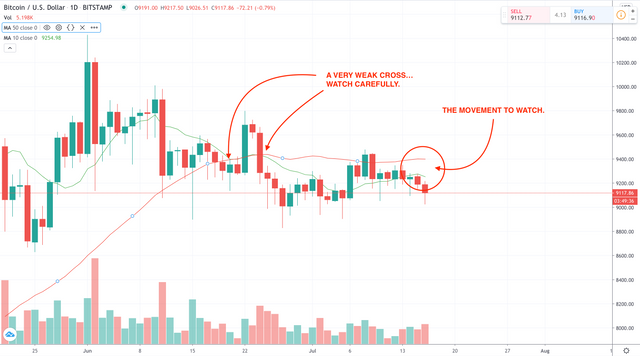
At this moment, we have crossed into what would be another drop, but the cross was a weak cross and the gap that has followed between the two MA's has stayed relatively small.
Bitcoin can't continue to move sideways forever but where it goes is anybody's guess. In the short term, keeping an eye on these moving averages would be wise.