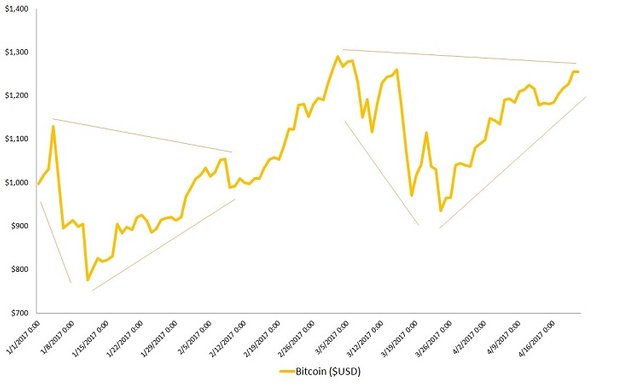
Bitcoin has been making significant moves as of late. Just a week ago, the king of cryptocurrencies was trading around $1,180. Although it had finally cracked back into four-digit territory following a sharp correction early in the year, the sideways consolidation was frustrating for many investors. After all, digital currencies are steadily becoming the new normal — and that means massive opportunities in days, not years.
Still, we may have gotten a bit spoiled by the rise of bitcoin. Half a year ago, bitcoin was trending at the $800 mark — give or take a few bucks. At time of writing, bitcoin breached the $1,250 level, bringing our trailing half-year return to more than 56%. This is the kind of consistent performance only available to cryptocurrencies — you’re just not going to get this performance out of the bland S&P 500.
For the doubters and critics of digital currencies, the discipline of technical analysis — ironically, a discipline that has finally found acceptance on Wall Street — forecasts bigger moves in bitcoin. From where we’re standing, the next upside target is $1,600.

This article has been truncated, see the full story at CrushTheStreet.com
Hi! I am a robot. I just upvoted you! I found similar content that readers might be interested in:
https://steemit.com/bitcoin/@bullishmoney/get-ready-for-usd1-600-bitcoin-says-technical-charts
Downvoting a post can decrease pending rewards and make it less visible. Common reasons:
Submit