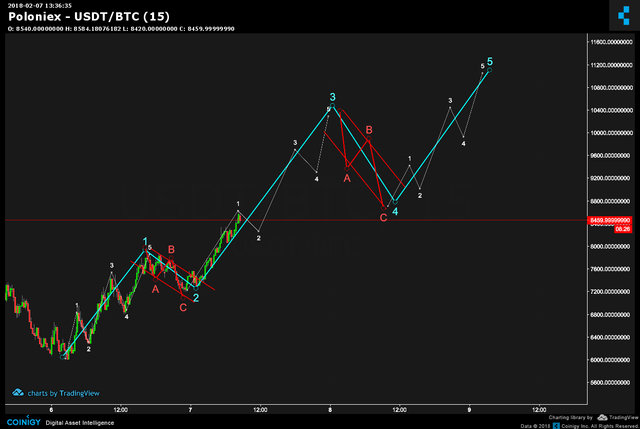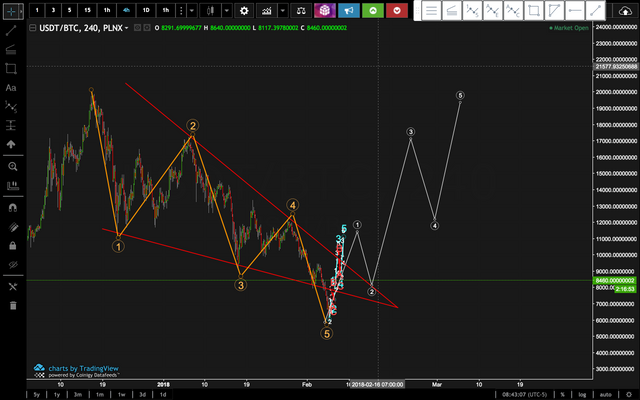
Possibly forming a barrier triangle, giving bullish momentum to finish 5th wave.
this is the chart I drew yesterday:

You can see its pretty spot on in the sense of the Elliott wave price action. The red target was not hit but that just means the correction was not very deep. no big deal. Afterwards we see the price continued up following my drawings as well!!
NICE!!
here is a short term updated chart :

here is a bigger picture:

( )
)


We are not liable for any reason for profits or losses
please make your own decisions

Thanks much for the update. Just a quick question, I am trying to understand the waves, If I buy now as wave 3 is in progress, end of wave 3 will hit the price around 10,400? Please let me know if my understanding is correct?
Downvoting a post can decrease pending rewards and make it less visible. Common reasons:
Submit
the bigger wave 3 yes, the longer term. Possibly in the next 1 -2 days.
but this is one count. my primary count. but there are alternatives like BTC dropping around 9200 - 9600 back for a big dip. so just be careful :)
Downvoting a post can decrease pending rewards and make it less visible. Common reasons:
Submit
Thanks for the quick response. So we are now at small wave 3 of the bigger wave 3, correct?
Downvoting a post can decrease pending rewards and make it less visible. Common reasons:
Submit
Upvoted
Downvoting a post can decrease pending rewards and make it less visible. Common reasons:
Submit