Bitcoin Market Sentiment on 2018-08-14

in bitcoin •  6 years ago 

Steemit Header v2 August 14.png

Hi everybody!

My goal here is to gauge the current crypto sentiment by asking TAs some questions and watching their Youtube videos and provide data on it. All the information here is for educational purposes only! These numbers aren’t buy/sell signals! Therefore, everything I write here is not financial advice! Please DYOR, trade responsibly and consider your investment decisions carefully!

I’m not here to point out who’s wrong or right, who’s a good or bad Technical Analyst (aka TA).
No one’s always right 100%. Nobody on the list below is a psychic or has a crystal ball (that being said, if there’s a psychic among you who predicts the future and do other awesome stuffs – please contact me ASAP. I want to be your friend 😆).

Some things I’d like to add:

  1. Sure, I could add the detailed analysis done by TAs, but I think many of you will be in "TL;DR" mode instead.
  2. These are just Technical Analysts that I know of. Of course, there are more of them on Twitter / Youtube. Feel free to suggest any other TAs. I’ll review them and maybe post their targets/comments next time.
  3. Some TAs don’t post Bitcoin charts often, so I will probably add or remove some names.
  4. Comment below if you find any mistakes (for example, incorrect info).
  5. If you have any ideas on how to improve the list and make it more interesting – please let me know!
  6. Just in case:
  • T1 means Target #1;
  • T2 = Target #2;
  • T3 = Target #3;
  • ST = Short Term;
  • MT = Medium Term;
  • LT = Long Term;
  • TF - Time Frame;
  • 1SAAT = One Step At A Time. Just means that Bitcoin price prediction is short term only.
  • The information in round brackets is @cryptocoq’s notes.
  • Please keep in mind that ST/MT/LT are all relative terms. Every TA has their own time frame definition. For some people ST can be a few days but for others it can be two weeks, etc.

Enjoy and if you like it, please share and spread the love!
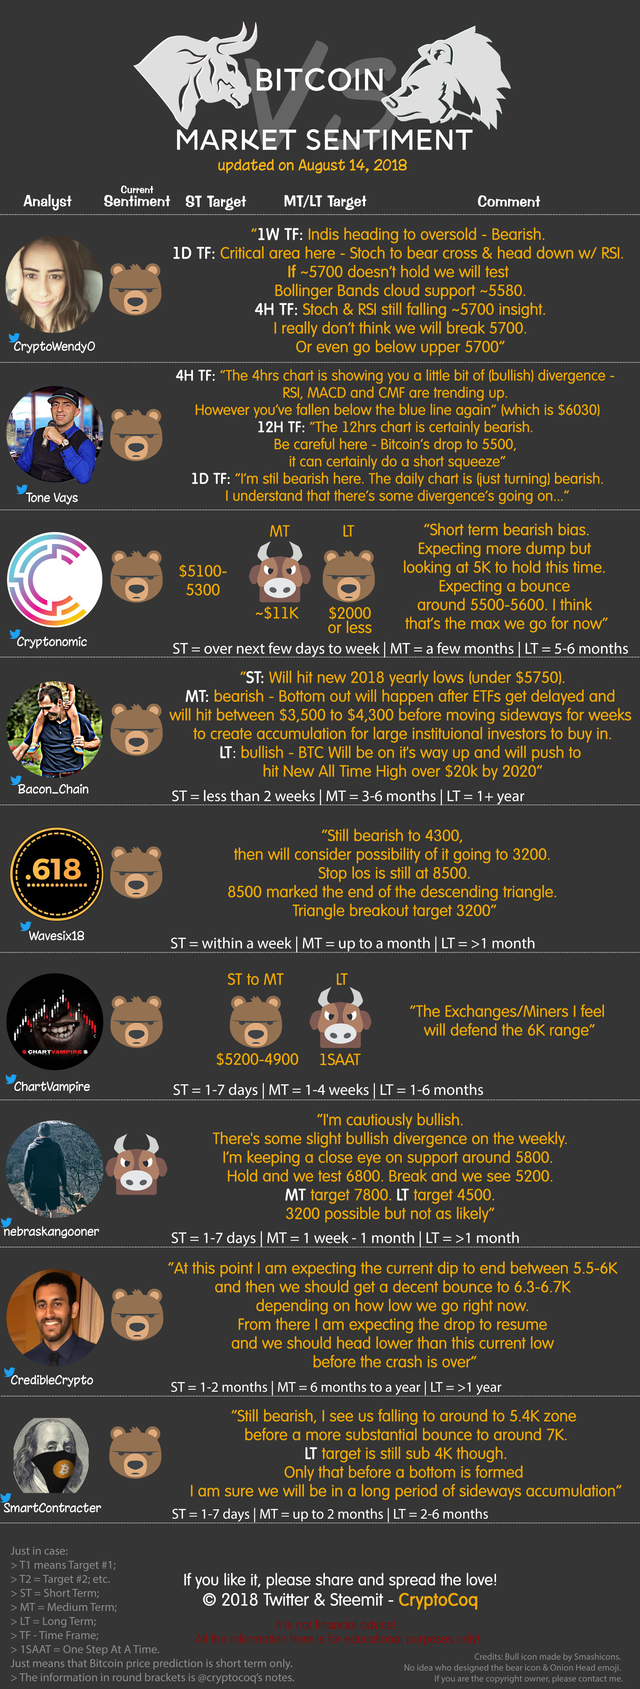
Steemit TA infographic - 2018-08-14.png


Analyst (in no particular order)
Current Sentiment
Target
Comment
TA's TF definition
Crypto Wendy O
bearish
refer to the comment →
1W TF: “Indis heading to oversold - Bearish”

1D TF: “Critical area here - Stoch to bear cross & head down w/ RSI. If ~5700 doesn’t hold we will test Bollinger Bands cloud support ~5580”

4H TF: “Stoch & RSI still falling ~5700 insight”

“I really don’t think we will break 5700. Or even go below upper 5700”
ST = 4-1D

MT = 1D-1W

LT = 1SAAT
Tone Vays
bearish
refer to the comment →
4H TF: “The 4hrs chart is showing you a little bit of divergence - RSI, MACD, CMF trending up. However you’ve fallen below the blue line again” (which is $6030)

12H TF: “The 12hrs chart is certainly bearish. Be careful here - Bitcoin’s drop to 5500, it can certainly do a short squeeze”

1D TF: “I’m stil bearish here. The daily chart is (just turning) bearish. I understand that there’s some divergence’s going on...”
Cryptonomic
bearish
ST: $5100-5300

MT: ~11K

LT: $2000 or less
“Short term bearish bias. Expecting more dump but looking at 5K to hold this time. Expecting a bounce around 5500-5600. I think that’s the max we go for now”
ST = over next few days to week

MT = a few months

LT = 5-6 months
Waves618
bearish
Still in a short position with SL at 8500

MT: $4300
“Still bearish to 4300, then will consider possibility of it going to 3200. Stop los is still at 8500.

8500 marked the end of the descending triangle. Triangle breakout target 3200”
ST = within a week

MT = up to a month

LT = >1 month
NebraskanGooner
bullish
refer to the comment →
“I'm cautiously bullish. There's some slight bullish divergence on the weekly. I’m keeping a close eye on support around 5800. Hold and we test 6800. Break and we see 5200. Mid term target 7800. Long term target 4500. 3200 possible but not as likely”
ST = 1-7 days

MT = 1 week - 1 month

LT = >1 month
Credible Crypto
bearish
refer to the comment →
“At this point I am expecting the current dip to end between 5.5-6K and then we should get a decent bounce to 6.3-6.7K depending on how low we go right now. From there I am expecting the drop to resume and we should head lower than this current low before the crash is over”
ST = 1-2 months

MT = 6 months to a year

LT = >1 year
BitcoinBenjamin (CIM)
bearish
refer to the comment →
“Still bearish, I see us falling to around to 5.4K zone before a more substantial bounce to around 7K. Long term target is still sub 4K though. Only that before a bottom is formed I am sure we will be in a long period of sideways accumulation”
ST = 1-7 days

MT = up to 2 months

LT = 2-6 months
Josh Bacon
bearish
ST: Will hit new 2018 yearly lows (under $5750)
“MT bearish: Bottom Out will happen after ETFs get delayed and will hit between $3,500 to $4,300 before moving sideways for weeks to create accumulation for large instituional investors to buy in.

LT bullish: BTC Will be on it's way up and will push to hit New All Time High over $20k by 2020”
ST = less than 2 weeks

MT = 3-6 months

LT = 1+ year
ChartVampire
bearish
ST to MT target: $5200-4900

MT: Bearish Double Bottom

LT: bullish
“The Exchanges/Miners I feel will defend the 6K range”
ST = 1-7 days

MT = 1-4 weeks

LT = 1-6 months
Authors get paid when people like you upvote their post.
If you enjoyed what you read here, create your account today and start earning FREE STEEM!