Trade analysts have recently been looking at the similarities between the Wycoff and Bitcoin chart. Surprisingly, both the charts look very similar. Good news is that we have already passed the phase A and B and the price would be moving up dramatically in phase C and D, according to Wycoff Accumulation charts. Let's see this in detail.
Wycoff Accumulation Explained
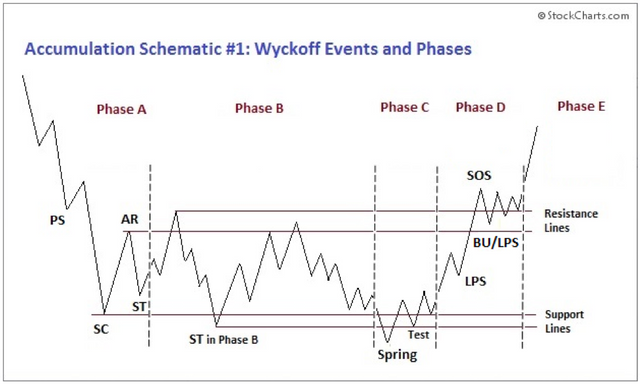
Wycoff Accumulation is a chart pattern that most of the trade analysts are already aware of. Wycoff is an accumulation, breakup, and markup scenario. If an asset resembles in this pattern than it is obvious that the asset is in accumulation mode and a huge breakout to the upside is expected in any time soon. Below is the Wycoff chart pattern.


In the above chart, we can see that Phase A is the price drop to the low and then in Phase B we can the price sitting in a range; that is, the price is kissing the highs, lows, highs, lows and repeating the pattern to remain in a particular range. This phase is the accumulation phase.
All of a sudden it breaks into a new low. This is Phase C and in this phase, we will see the lowest level in price among all phases. This drop gives us information that there is demand pent up waiting for the opportunity. After this drop, the price will push up above the resistance range that was seen in Phase A and B and will break through this resistance.
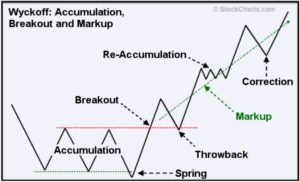
When the price breaks out of this resistance, we can see some momentum in the charts. Momentum does not mean price was moving at a quick pace, but it is the volume that is increasing gradually. This is the Phase D, and we can see lot more participants coming in to buy the asset causing it to blast through the highs. Even if the price breaks out and moves up, there would be a short retrace in Phase D as shown in the chart. After the short retrace, there would be big movement in price, and the chart will be in bull trend. After this big movement, there will be a re-accumulation phase where the price will remain in the range for a short period; this would be a mini version of Phase A, B, C as seen in the chart.
After the re-accumulation, there would be a small correction, and the price will continue to move upwards as shown in the charts. This is the last phase (Phase E), and this would be the Mania Phase where the price would test new ATH.
Bitcoin Chart Comparison with Wycoff
Looking at the Bitcoin price chart, we can confidently say that it resembles Wycoff Accumulation chart. Below is the Bitcoin Chart from one of the Trade Analysts.

If we compare the above Bitcoin chart with that of Wycoff, we can say that we have already completed Phase A and Phase B. We are in Phase C where the price is testing the new lows. Once it is completed, we will enter the Phase D where the price will move upwards breaking through the resistance. This resistance is the upper range that was touched twice, and price remained below this range for quite some time. The breakout will take up to the higher price, and then again we will see re-accumulation where the price will remain in a range for a short period. So we are currently in the accumulation phase, and the breakout is possible anytime soon according to Wycoff Charts.
We will have to wait and watch if Bitcoin will follow the Wycoff and take us to a new ATH (all-time high).
Posted from my blog with SteemPress : https://cryptocoremedia.com/bitcoin-is-in-wycoff-accumulation-phase-huge-price-surge-expected/