There are no ways to predict the future (no one can do it), but of course, there are specific signs we can identify to have an edge when it comes to predicting possible outcomes.
Could the BTC crash be predicted? YES. Is it the end of the BTC? NO. First, let's cover the crash aftermath.
Here are some signs pointing towards the BTC crash:
BTC movement from OCT 2017 to Mid Dec 2017 was a Parabolic Movement, and yes, every single Parabolic movement ends up with a crash. Parabolic movement = Exponential movement. In this case the crash it is also expected to be in a parabolic movement (exponential). It is like a rubber band that has been stretched. The more you stretch it, the stronger and faster it retraces.
Wall Street was missing the party, and BTC was already at 20k. How to join the party? They created BTC futures contracts, so they could easily manipulate the price, crash it down and make massive money on the crash.
FUD: After the parabolic movement, a lot of media and governments started to generate FUD on BTC and all cryptocurrencies. This makes a lot of newbies to get scared and sell off all their BTCs and cryptos.
Even when the crash was something inevitable, how can you identify a sign (technically speaking) that shows that something isn’t going good and how do you know when to sell? The truth is that you don’t need any fancy stuff nor fancy Indicators. You just need 2 things: EMAs and Volume. EMA (Exponential moving average) – Normally the 9,20,50 and 200 EMAS. 9 EMA for short-term movements and 200 EMA for the long term.
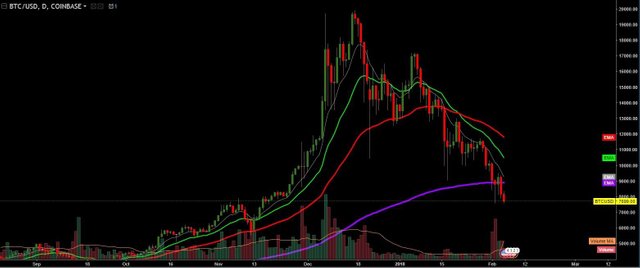
Grey Line: 9EMA
Green Line: 20 EMA
Red Line: 50 EMA
Purple Line: 200 EMA
When every single candle bar is above all EMAs, it indicates an Uptrend. When every single bar is below every EMA, it indicates a downtrend.Every EMA works as a dynamic support and/or resistance, so the more EMAs you break, the stronger the movement.
a. When a pair is moving up and retraces back below the 9EMA (grey line), and Candle closes below 9EMA, this is the first sign that the squeeze may have ended. Also, if the volume comes with it, the movement it is even stronger.
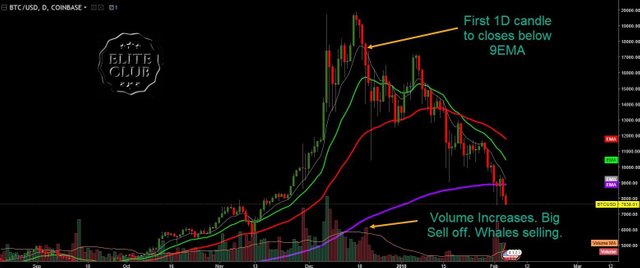
I would consider this as the perfect moment to sell (perhaps this is anticipated as 9EMA is still a fast-moving average, but it ends up being the best price to sell).
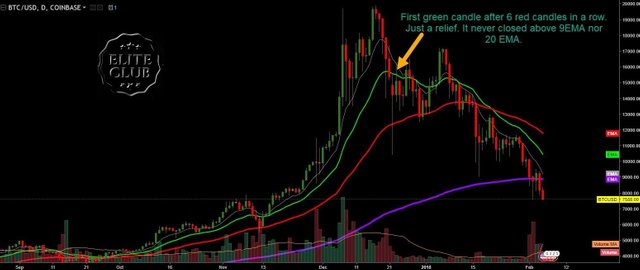
b. After the price closed below the 9EMA, it had another 2 red days and a total of 6 red candles days in
a row since the top. Maybe this should be used as a rule of thumb: “From 3 to 5 candles in a row of the same color, it may come as a relief (different candle color)”. So, in this case after 6 red candles, a green candle came, but as long as the relief does not close above the 9EMA, then it is just a relief.
Also, the next obvious support level after closing below the 9EMA is the 20 EMA so breaking down this level would be a sign of a downtrend.
Summarizing this point, the price kept going down below 20 EMA and the relief movement (green candle) after 6 red candles in a row did not close above the 9 EMA or the 20 EMA. This is a BIG sign that the movement to the up is already over and time to sell.
c. Next Resistance level to test now is the 50 EMA (Red Line). Prices touched it and bounced back temporarily above 9EMA and 20 EMA. Yes, maybe it is time to buy again since the retracement of the Big movement to UP may be over, and the BIG rally to the Up may continue but…
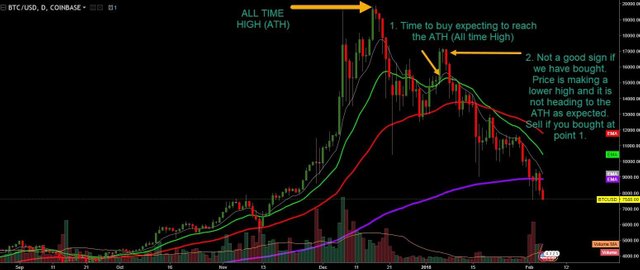
In an uptrend, a red candle does not mean the trend is Over; it is just a relief. Same as in a downtrend, a green candle does not mean the downtrend is over, it is just a relief.
d. When the price is making a lower high, it means that the trend is going down. So, as I said, the next level of support is the 50 EMA. Yes, the price crossed and closed down below 9EMA, 20 EMA, and 50 EMA. This is a RED WARNING if you have not sold. Look at how it closed below the 50EMA then just had a relief and then broke back down strongly.
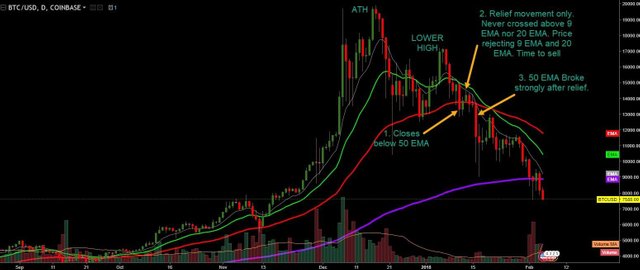
e. After breaking the 50 EMA, we can now expect a free fall to the 200 EMA (purple line) and so it happened (so next resistance level is the 200 EMA). At 200 EMA, there is relief movement, but it is just that, “a relief movement.” When price close below 200 EMA and maintain that level, the long-term trend has officially changed.
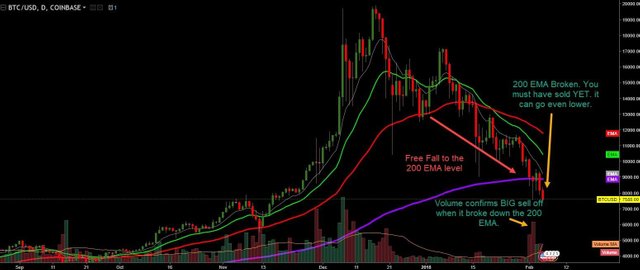
Ok, as you can see, there are many, many signs before a crash occurs.
Now let’s spot the dip
Most of the times when we see a green candle we think, “oh, it is recovering, the downtrend is over, let’s buy again”. This is a big error. Ok, a green candle is a nice sign, but it is never enough. You need to wait for confirmations. As you have heard “It is better to arrive late to the party than early” This can help you to prevent fake recoveries.
Red to green candle. If you are in a strong Downtrend (All red candles) and you see a Green candle appearing, DON’T jump immediately to buy. Ok, all trend reversals start with a green or red candle, so any green candle is a potential start of the recovery but never enough. So, a green candle is a good sign, but most of the time, it is just a relief before the movement continues down.
Normally when approaching any new EMA (Support/Resistance) you would see a relief
4movement, but that’s all.
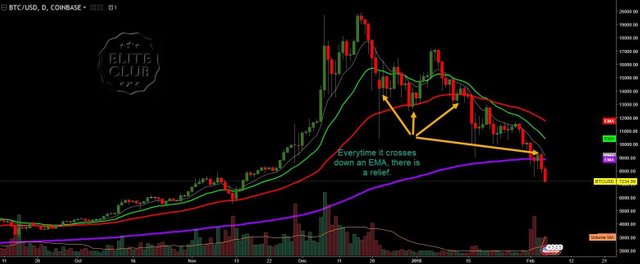
Having said that, if you have a red to green candle but not crossing UP any EMA, then exercise some patience. It is just probably a relief.
If you have a red to green candle + Crossing Up an EMA (closing above the EMA). This is a better sign.
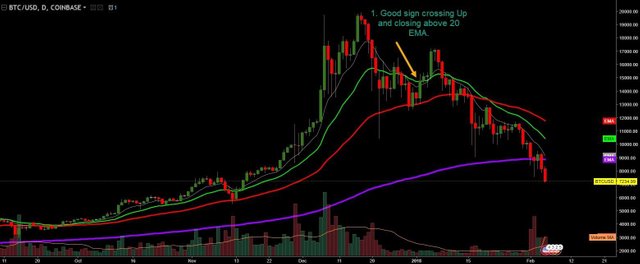
Wait for the confirmation…After meeting these conditions, then wait till the next day opens above the previous candle (point 1 in the image and follow the numbers in the image to understand how to manage a trade)
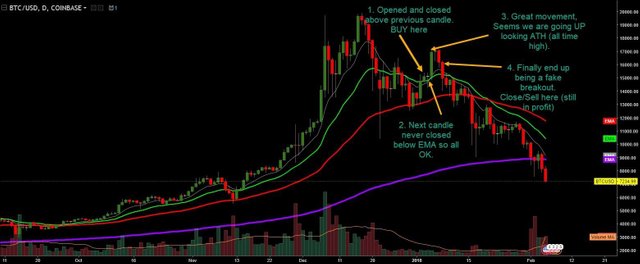
Once we are faked out with a false breakout (with profit, fortunately), keep looking the same conditions (red to green candle + crossing Up above EMA + next day candle confirmation.). Volume should play an important role here. You would expect a more significant volume on the green candles than on the red candles (meaning more buyers). If a bigger volume is observed with the red candles, then it means that there is a lot of sell-off (don’t buy)
Also, look to the left side of your chart to find 7previous resistance or support levels (At these levels you can find a relief or consolidation period). Look at the greens in the image; they depict previous resistance.
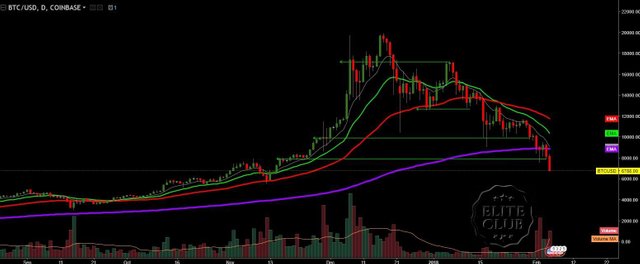
- In the absence of all these conditions, there is no hope, and we can still go deeper and deeper.It is not the end of the BTC, it is just a downtrend and we keep trailing the dip.If you are an aggressive trader, 1 or 2 conditions should be enough for you to go long, but if you are more conservative, then wait until more conditions are met even if you arrive little late to the party.Is this a crystal ball? No, EMAs are not the Holy Grail, but it is vastly used by professional traders (and that’s close enough)Can the trend get back up? Yes, but there is no sign unless it starts crossing the EMAs to the UP. More importantly, these EMAs can be used to analyses any cryptocurrency pair.
Hope you have enjoyed analysis, ensure you make wise investments.
Follow me for more updates and don't forget to upvote and Resteem. All the best.
...
The only thing I know is that BTC crash at the same period EACH year.
Downvoting a post can decrease pending rewards and make it less visible. Common reasons:
Submit
I guess you not an analyst. You only buy and sell when at profit
Downvoting a post can decrease pending rewards and make it less visible. Common reasons:
Submit
that is a very thorough explanation. thank you. we all suffer from FOMO and buy at the wrong time it seems.
Downvoting a post can decrease pending rewards and make it less visible. Common reasons:
Submit
That's the problem we are currently facing giving the whales much need an angle to buy when at the dip.
Downvoting a post can decrease pending rewards and make it less visible. Common reasons:
Submit
That's the problem we are currently facing giving the whales much need an angle to buy when at the dip.
Downvoting a post can decrease pending rewards and make it less visible. Common reasons:
Submit