
As bitcoin continues to bounce around the $3000-$4000 price range, one might wonder where the coin is going in terms of trend. Crypto YouTuber DataDash thinks bitcoin might revisit lows.
Trading sideways
After sustaining a price gouge of more than 80% since all-time highs, crypto's largest asset has bounced around the $3,000 range for quite some time. Bitcoin hit its most recent low around $3,100 on December 15, 2018. Since then, the asset has traded relatively sideways, between roughly $3,100 and $4,300, according to TradingView data. The kind of cryptos appears to still show indecisiveness regarding a definite new trend.
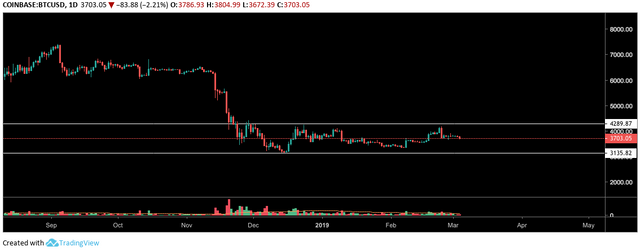
Image Courtesy: Tradingview.com
The DataDash take
In his March 4th video, DataDash YouTube channel host Nicholas Merten gave his thoughts on BTC's price action.
Merten mentioned he thinks the next few weeks will provide price movements around the previous $3,000 lows. "I think this is the range where we can actually start to get a little bit optimistic, or at least feel like, you know, we're going to be pushing sideways for a while," Merten said.
Expressing his rationale for such speculation, Merten pointed to the Coinbase bitcoin TradingView chart. The analyst said some of the most telling information behind his long-term reasoning has come from BTC's weekly and monthly moving averages. Bitcoin made multiple interactions with the 200-week moving average (MA) in the past weeks, with price relatively close to the 200-MA at the time of Merten’s video.
Merten explained,
Right now the 200-week [MA] is sitting at around a little bit below $3,400. It’s not that hard to believe that we’re going to come back down to test this indicator. This has held historical significance, as well as the 50-month.”Switching over to the Bitstamp chart for bitcoin on TradingView (Bitstamp has longer historical time data for bitcoin), Merten pointed to the 50-month MA. The king of crypto’s price appears to have interacted with the 50-month MA near the bottom of the 2015 bear market, before pushing upward. Merten noted bitcoin’s market valuation is currently near the 50-month MA.
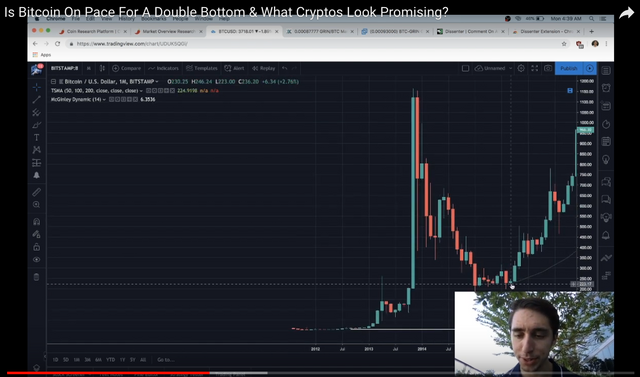
Image Courtesy: DataDash Youtube
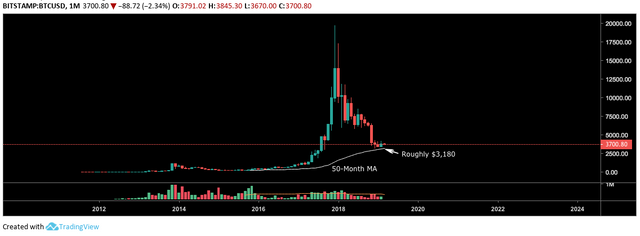
Image Courtesy: Tradingview.com
Motioning toward bitcoin’s price above the 50-month MA, Merten said,
I think that this is going to come back down, over the next month or so in March and April, and we’re gonna retest those lows, and it’s going to come down at a big even like $3,000, which was the first point of resistance when bitcoin was having really the serious part of its rally in 2017, so, it makes a lot of sense. It’s a pretty significant level, and it’s about the same percentage decline that we’ve seen in previous bitcoin cycles.”
A view from another indicator
Merten also added his thoughts relevant to another indicator called the McGinley Dynamic. Going back to the Coinbase bitcoin TradingView chart (Bitstamp reportedly did not have McGinley Dynamic indicator), the trader mentioned how BTC's price previously reacted to the indicator as support and resistance on the daily chart.Bitcoin’s Coinbase daily chart below shows price interacting as both support and resistance quite nicely as price moves above and below the yellow line (McGinley Dynamic).
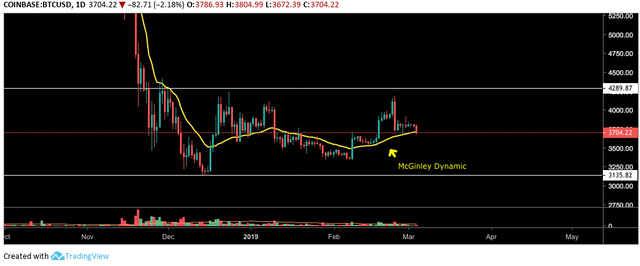
Image Courtesy: Tradingview.com
Adding interaction with a trend line Merten previously drew for price action, he posited, “My view in the short-term, is that we're going to be breaking this McGinley Dynamic, and that with that, we’re going to come down on this previous line of resistance and potentially try to make it support.” The analyst continued, “Much like we saw here through most of January and early February, I think we’re going to see a slow grind on what was previous resistance, down to either the previous lows or down to a specific level at $3,000.”
(The mentioned trend line is the white downward angled line in the picture below).
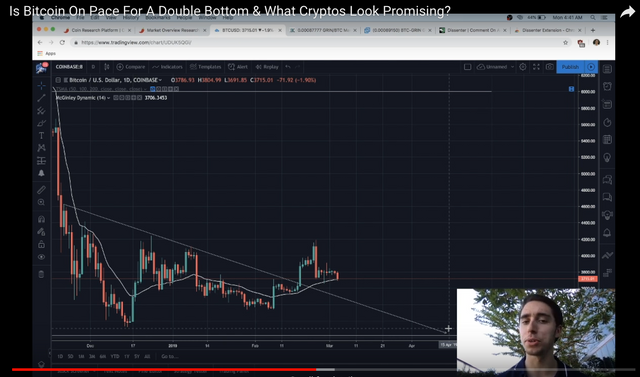
Image Courtesy: DataDash Youtube
Summarizing his thoughts, Merten thinks such price action might possibly occur around mid-late April or early May. He also added that this market valuation could possibly break through the mentioned areas and see another selloff, and he stated it might not take too much liquidity to cause such a downfall, due to a lack of volume in the market.
*Merten did denote that he is not “an advanced TA [technical analysis] trader comparative to those in the space who are probably a little more active, but I will say that using these kind of indicators and using long-term metrics that we’ve seen that have been proven to work in previous cycles, I think are important to use this time around.”
*This article is based on opinions, speculations, and interpretations from the author and others, and is not in any way financial advice. Writing about price levels is purely speculation, subject to speculatory bias. Nothing written is any kind of advice whatsoever. Proceed only at your own risk.
Originally posted on Crypto Insider : https://cryptoinsider.com/bitcoin-price-could-be-headed-back-down-to-lows/
Congratulations @cryptoinsiderhq! You have completed the following achievement on the Steem blockchain and have been rewarded with new badge(s) :
Click here to view your Board
If you no longer want to receive notifications, reply to this comment with the word
STOPTo support your work, I also upvoted your post!
Do not miss the last post from @steemitboard:
Vote for @Steemitboard as a witness and get one more award and increased upvotes!
Downvoting a post can decrease pending rewards and make it less visible. Common reasons:
Submit