Bitcoin (BTC) has pushed the upper limits of the $3,000 price range over the past several days. DataDash recently provided some interesting price analysis on crypto's largest asset.
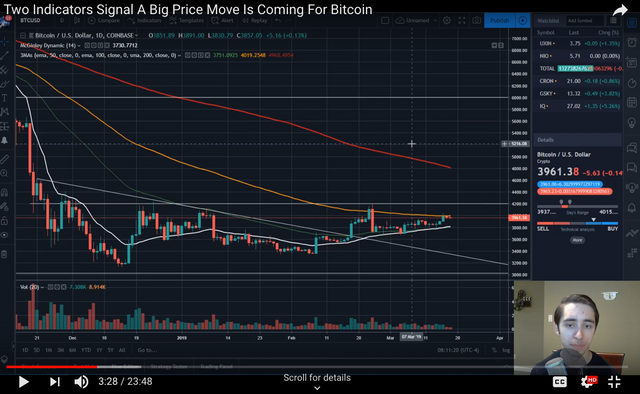
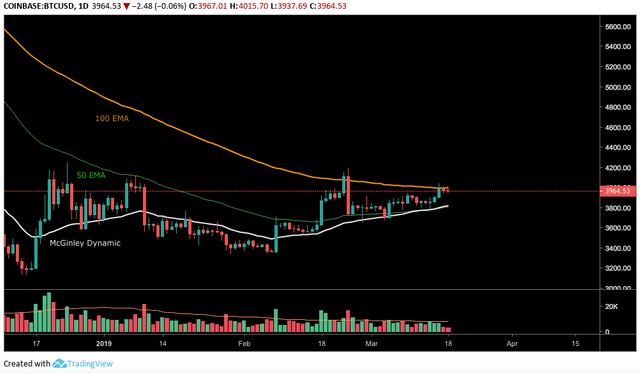
In a March 18, 2019 video, DataDash YouTube channel host Nicholas Merten showed bitcoin's price lies (at the time of this writing) between the 100-day exponential moving average (EMA), and the McGinley Dynamic, two chart indicators.
(The McGinley Dynamic is the thick white line below price, and the 100-day EMA is the thick orange line.)

Image Courtesy: YouTube.com (DataDash)

Image Courtesy: TradingView.com
Merten mentioned a possible break or downward in price, in association with squeezing price action. The trader described what he calls "the twilight zone."
He continued to explain,
It has to usually do with a squeezing between something like moving averages or, you know, Bollinger Bands. Things of that sort, or wedges. Things that coil in price."Merten noted this action currently can be seen in bitcoin, with price between the 100-day EMA and the McGinley Dynamic.
The McGinely Dynamic, as well as the 50, 100 and 200-day moving averages, hold alot of significance. Especially when you can spot how they're coiling in price action."The trader explained the 50-day EMA showed prior resistance that seemingly has now turned to support, which he noted appears positive for the bullish crowd. Similarly, he noted a possibility that the same situation might occur with the 100-day EMA.
Merten said the 100-day EMA, 50-day EMA and McGinley Dynamic currently appear to show basic levels of support and resistance. "It's a matter of whether or not the market can get a close above that 100-day [EMA]," he added. Furthermore, the analyst pointed out the 100-day EMA currently acting as resistance, with the 50-day EMA and McGinley Dynamic providing a level of support.
Additionally, Merten noted price might be further squeezed between the indicators leading to a move up or down.
What's going to happen? Is it going to break up or break down? I can't predict that guys. Volume is so low in this market. I have no doubt that any big price moves could be caused by little to no buying or selling volume."He did, however, point toward the importance of a price close above or below the mentioned indicators. A close on the daily chart above the $4,200 range might give Merten a bit of confidence, he expressed, adding "I think at that point, you're ready to go up and test towards the 200-day moving average."
On the flip side, the analyst said a move and close below the 50-day EMA and McGinley Dynamic might lead down toward $3,300 levels. He also connected these comments to his previous thoughts on a possible double bottom for bitcoin.
Merten also noted he does have experience, but viewers should use their own judgment and that he is not a "vast TA [technical analysis] expert."
*This article is based on opinions, speculations, and interpretations from the author and others, and is not in any way financial advice. Writing about price levels is purely speculation, subject to speculatory bias. Nothing written is any kind of advice whatsoever. Proceed only at your own risk.
Originally posted on Crypto Insider : https://cryptoinsider.com/datadash-gives-interesting-price-analysis-on-bitcoin/