Bitcoin has remained relatively uneventful over the past few weeks, seeing mostly range-bound activity. Let's see what the charts possibly imply about bitcoin's price action.
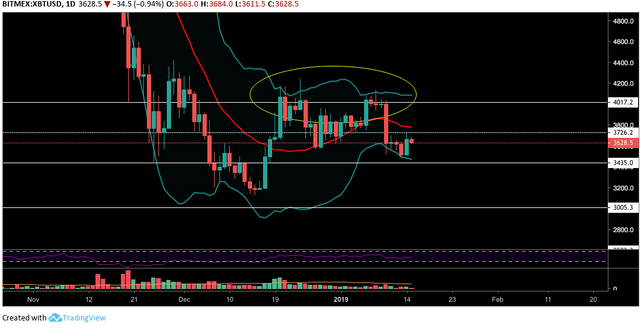
1-day chart

Image Courtesy: Tradingview.com
Bitcoin's daily candle chart (Bitmex) appears to show a local double top for the current bounce from the $3,200 range. (A double top shows price's inability to break the same resistance zone on two separate occasions at the asset's price peak.)
The second top showed a lot less conviction than the first rally from the $3,200 bottom range. Volume en-route to the first local top also showed more buyer presence than the second top.
Another concerning factor is the inability for bitcoin's price to hold above $4,200, and then push higher with confidence. After seeing such volume and force on the last few major downward price movements, it appears as though buyers are weak in comparison, not yet ready for an ultimate trend reversal.
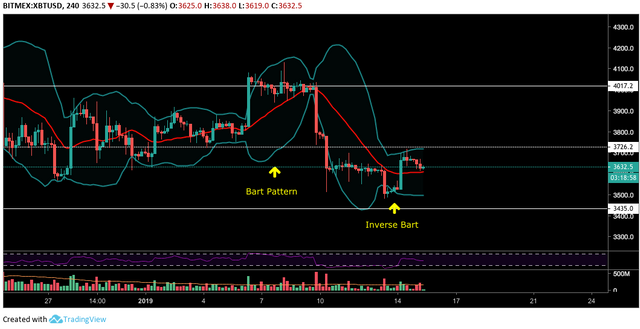
4-hour chart

Image Courtesy: Tradingview.com
Bitcoin's 4-hour chart shows periods of notable price consolidation, followed by stark price swings upward or downward. The crypto space refers to these as "Bart Simpson patterns" due to their resemblance of the TV character's head shape.
https://twitter.com/thecryptodog/status/978466360912154624?lang=en
Bart Simpson patterns basically show up due to a lack of trading liquidity, as mentioned in a Crypto Finance article last year.
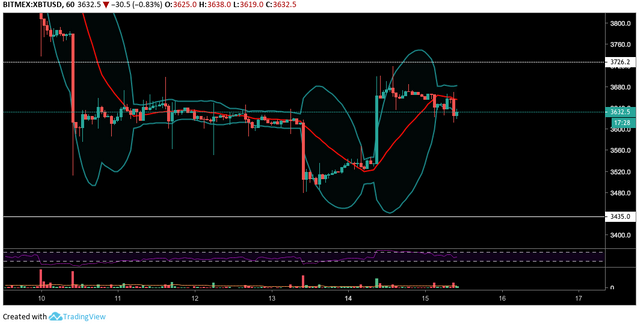
1-hour chart

Image Courtesy: Tradingview.com
The 1-hour bitcoin chart shows significant consolidation, hour after hour, between Bart pattern swings. During such consolidation there are many long wicks to the up and downside, indicating possible manipulation, stop loss hunting and bot trading action.
The Bollinger Bands® are currently somewhat narrow, with price heading downward, possibly toward another Bart pattern completion, seeing increased volatility along the way.
Bollinger Bands are a trading indicator used to show price range and volatility, as well as other price aspects.
Tone's take on the monthly chart
On a larger monthly time frame, notable crypto influencer and technical analyst Tone Vays had several thoughts on bitcoin's price action in his video yesterday.
Vays said things did not look good regarding bitcoin's monthly candle chart. Bitcoin's price has not yet touched the 50-month moving average, which he believes price will hit and even break eventually.
Vays also noted bitcoin has never in its history closed a monthly candle below the 50-month moving average. Vays stated this action would break comparisons to the 2014 bitcoin price fractal.

Image Courtesy: YouTube.com
Vays outlined a possible future scenario which sees bitcoin breaking the 50-month moving average, flushing down close to the $1,300 price zone, and then bouncing back up without closing a monthly candle below the moving average, thus retaining the fractal comparison. If a candle opens and closes below that moving average, however, things become even more bearish.
"If we close below the 50-period moving average, and then we open a candle below the 50-period moving average, and then we close that candle below the 50-period moving average, bitcoin gets into serious serious trouble," Vays explained.
At the time of writing, bitcoin is at $3,673 on CoinMarketCap.
*This article includes opinions from the author and is not in any way financial advice. Writing about price levels is purely speculation, subject to speculatory bias. Nothing written is any kind of advice whatsoever. Proceed only at your own risk. Consult a licensed professional prior to making any decisions.
Originally posted on Crypto Insider : https://cryptoinsider.com/where-is-bitcoin-price-heading/