Bitcoin (BTC) is trading 30% below its November 10 all-time high (ATH) above $69,000. Bitcoin price has undergone a series of significant corrections that has it lose several crucial levels. If Bitcoin price experiences two corrections like those that have been experienced over the past one month, the big crypto could tank even further.
Bitcoin Price Correction As Bears Target The September 21 Range Low
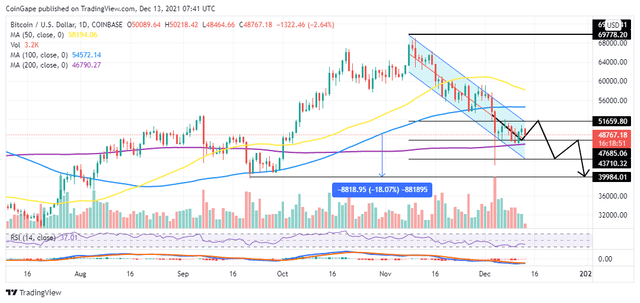
BTC/USD continues to trade within the confines of a descending channel at $48,767 with bears focused on undoing the gains made over the weekend.
Technical outlook as seen on the daily chart point to a possible deeper correction if the pioneer cryptocurrency cannot break out of the descending parallel channel. Thus, if Bitcoin price sees corrections of the magnitude seen between November 15 and 16, on November 26, between December 3 and 4, and the recent on December 09, it might fall to areas below the $40,000 psychological level.
This will be particularly possible if Bitcoin closes below the immediate boundary around $47,685 embraced by the middle boundary of the descending channel. If this happens, BTC price might drop to tag the lower boundary of the channel at $43,710.
Bitcoin might, however, find support at $46,790 embraced by the 200-day Simple Moving Average which might cause it to rise back to tag the middle boundary.
However, immense selling pressure is likely to overcome the support at the 200-day SMA and at the lower boundary of the channel which may cause a deeper correction in Bitcoin price with the September 21 range low at $39,984 in the offing. If this happens, Bitcoin could drop as much as 18% from the current price.
BTC/USD Daily Chart

Bitcoin price Daily Chart
Note that the fact that Bitcoin price is trading below crucial levels such as the $60K and $50K psychological levels as well as the 100- and 50-day SMA at $54,572 and $58,194 suggests that BTC bulls face stiff competition upwards, validating the pessimistic outlook.
Moreover, the down-sloping moving averages and the position of the Moving Average Convergence Divergence (MACD) Indicator below the zero line in the negative region accentuate Bitcoin’s downward outlook.
Looking Over The Fence
On the upside, Bitcoin price requires support from the wider market to invalidate this bearish outlook. With Bitcoin adopters like MicroStrategy adding to their Bitcoin reserves and margin traders remaining bullish as reported by Cointelegraph, the dip might be here suggesting a possible price rebound.
For this to happen, Bitcoin has to break out above the descending parallel channel by closing above its upper boundary at $51,659.
If this happens, BTC will reclaim the crucial $50,000 level with the next logical option being $60K and thereafter a rise to new all-time highs, which, according to some analysists, might be seen in early 2022.