CryptoKraze here
Possibility on 30 Minutes Chart

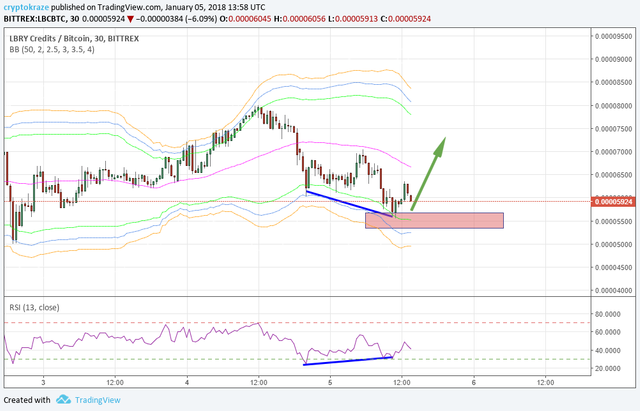
If you look at the 30 minutes chart, you will see that a bullish divergence has formed because price has made lower lows and RSI is making lower high, which mean blue lines are going opposite direction. RSI has gone below 30 level and now moving nicely above 30 level, so I am expecting it to go even higher. Price has touched the lower bollinger bands and now it will move up nicely. I have taken this trade as a scalp to make some quick profit.
- I have a buy entry at 0.00005700 with my profit target will be around 0.00006800 or above.
- Stop loss just below the entry area is must for trading if you don't know the Averaging Technique in Crypto Trading.
Crypto Trading is risky business and you can loss partial or full amount of money. Trade at your own risk with that money only you can afford to lose. Bitcoin unexpected move will make this analysis void.


The RSI is moving to overbought meaning less likelihood of a trend reversal. Worth looking at the MACD to see whether the trend is reversing. 5 & 9 period MAs will also show this better than Bollinger during this setup. Looks to me to continue downtrend until oscillators say otherwise. Just my take - hope it helps. 😎
Downvoting a post can decrease pending rewards and make it less visible. Common reasons:
Submit
How do you think or what bitcoin price predictions in 2018 will it rise or fall?
I want to survey some people's opinions
Downvoting a post can decrease pending rewards and make it less visible. Common reasons:
Submit
Time to Double .. No Triple... No Quadruple your Crypto Earnings.
Sign up today!
Never miss one of @CryptoKraze's remarkable Analysis
With instant SMS Notifications you will never miss a post from @Cryptokraze, the master of the Cryptocurrency Technical Analysis.
Be the first one to the Crypto Exchange to place your buy orders by being the first one to read CryptoKraze's Analysis.
Sign up Today For the Crypto Kraze SMS Service
Just my two STEEMS Worth.

Downvoting a post can decrease pending rewards and make it less visible. Common reasons:
Submit