CryptoKraze here
Possibility on 1 hour Chart
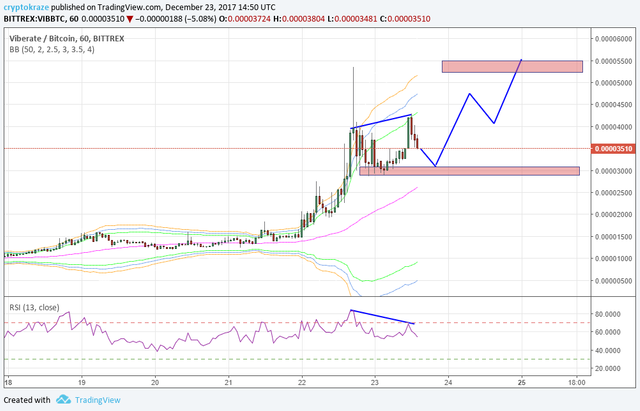
Vibrate has made a massive surge in price and many of you are looking to get enter in this train. Well, do not be in hurry because a bearish divergence has formed and it will come down to little support it has formed. RSI is quite oversold so we have to wait a little before we can enter and I have highlighted the entry zone as well. If you look at the bollinger bands then you will see price is touching the upper bands so it is more like to come down, most probably to the median line.
- I will wait for a little more dip just above the red highlighted area and my profit target will be around 5000 to 6000 satoshi.
- Stop loss just below the red highlighted area is must for trading if you don't know the Averaging Technique in Crypto Trading.

Crypto Trading is risky business and you can loss partial or full amount of money. Trade at your own risk with that money only you can afford to lose. Bitcoin unexpected pump or dump will make this analysis void.

great post brother but bitcoin expectation please?
Downvoting a post can decrease pending rewards and make it less visible. Common reasons:
Submit
See my post on bitcoin
Downvoting a post can decrease pending rewards and make it less visible. Common reasons:
Submit
Very
Downvoting a post can decrease pending rewards and make it less visible. Common reasons:
Submit
wahh cool his blog. I like. very good votes. success always for you yes.
Downvoting a post can decrease pending rewards and make it less visible. Common reasons:
Submit
very important to do the analysis and invest accordingly need to be careful
it's a nice blog
Downvoting a post can decrease pending rewards and make it less visible. Common reasons:
Submit
Great info, thanks!

Downvoting a post can decrease pending rewards and make it less visible. Common reasons:
Submit
Good post :)
Downvoting a post can decrease pending rewards and make it less visible. Common reasons:
Submit