With it's characteristic reckless abandon, BTC charged headlong - ever the bull in the china shop (an apt analogy in so many ways) into the fate that had been awaiting it for so many days. The unstoppable force against the immovable object - and this time, the immovable object seems to have won.
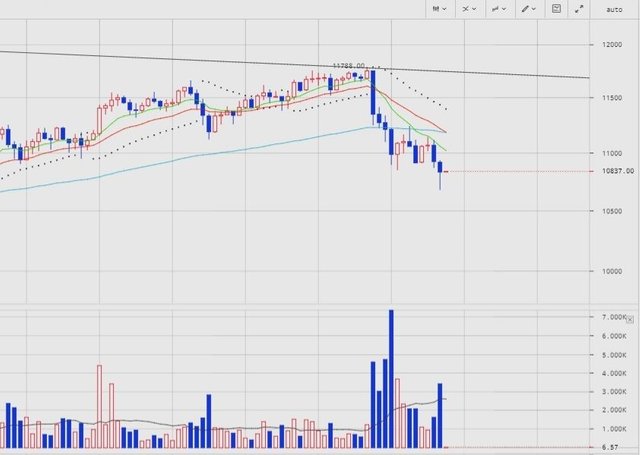
Once again, the previous Cryptonym post was almost dead on. I estimated an extrapolated third peak around $11,529 (it turned out to be $11,788 but technical analysis is much art as it is science and drawing straight lines was never my forte), dropping down to natural support at the $11,000 mark, which turned out to be a great short. As I suspected, this has been followed by the unmistakably deep, black abyss of falling prices as the currency moves once again into unfriendly territory, with no shelter for significant distance - the low $10,000 range or more solidly, at $9499. At the time of writing, it is barely holding on to the $10,800 mark. (fig.1):
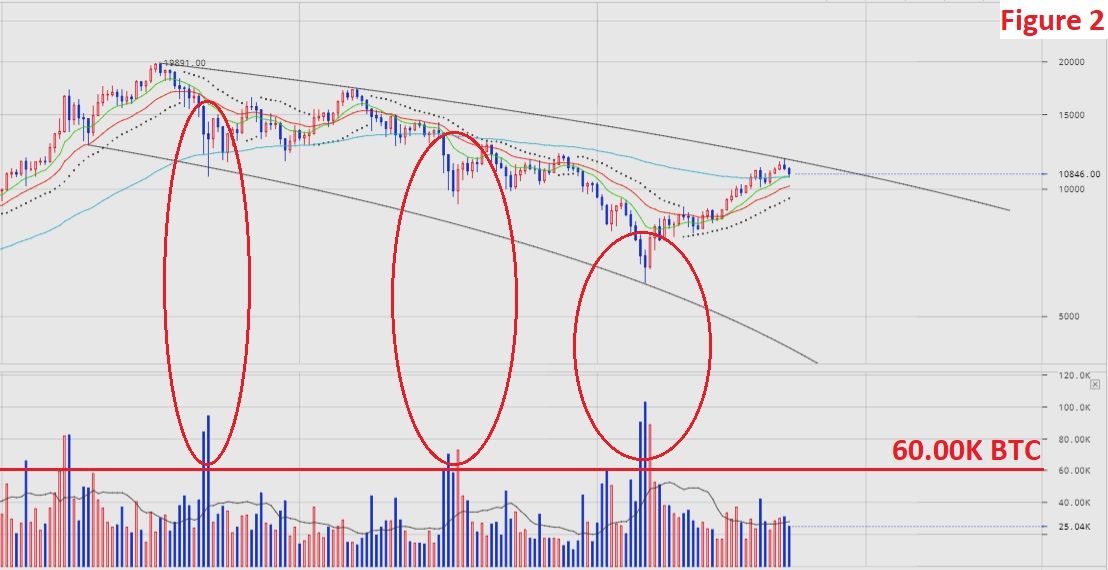
The natural question from here is whether or not another test of the higher trend line could be imagined, or if the price action is likely to dive into panic territory. Looking at the volumes traded during previous major selloffs, it seems the magic number for selling volume in major dips is around sixty thousand BTC per 12 hour period for the creation of true panic crashes. The volume for the four hours that have elapsed of the current 12 hour time period already stands at 25 thousand BTC so it could well be trending in that direction - but with moves of that magnitude, even though they seem to be becoming more and more common, you can't bet on them until they appear (fig.2):
Potential plays:
Short now
- Shorting is always risky - so be careful of the squeeze
- Unclear how much further to fall but could be as low as $9499, or maybe more conservatively the low $10,000 range.
- Consider recent near term highs such as $11,000 and $11,788 as risk levels
- Avoid stop loss orders (better to have alerts and enter orders manually, since market makers and whales seem to enjoy 'running the stops' and pushing others out of trades - either to take commission or to see if they can turn the tide to their own advantage respectively).
Cryptonym.
NB.
Values in USD are representative of prices traded on the Bitfinex exchange.
Times are UTC standard.
This does not constitute official investment or trading advice. Your losses are your own.
If you appreciate this work and would like to support Cryptonym, please consider donating:
Steem - via Steemit
Fiat - https://www.patreon.com/CryptonymFund
Bitcoin - 3EYtdz4J7aCsW3wnz64rMvqzmkyBKPahee
Bitcoin Cash - 17VXEM8gRYrms1jtoadoLob5DvBFwWkVug
Litecoin - MQhdRXjojwCwzFLQxtExMKaaYyFZ9ftdB7
Ethereum - 0x46Aa8d31f5d1a7e72b38A13e5E7F9bD5FBC7d8ea