$7.5K? Bitcoin Price Charts Hint at Bull Move Ahead

The stagnant bitcoin charts could spring back to life in the next 24 hours, with a bullish move possibly on the cards.
The cryptocurrency has been moving in a more or less sideways manner for over a week now and - currently trading at $6,848 on Bitfinex - is largely unchanged on a 24-hour basis.

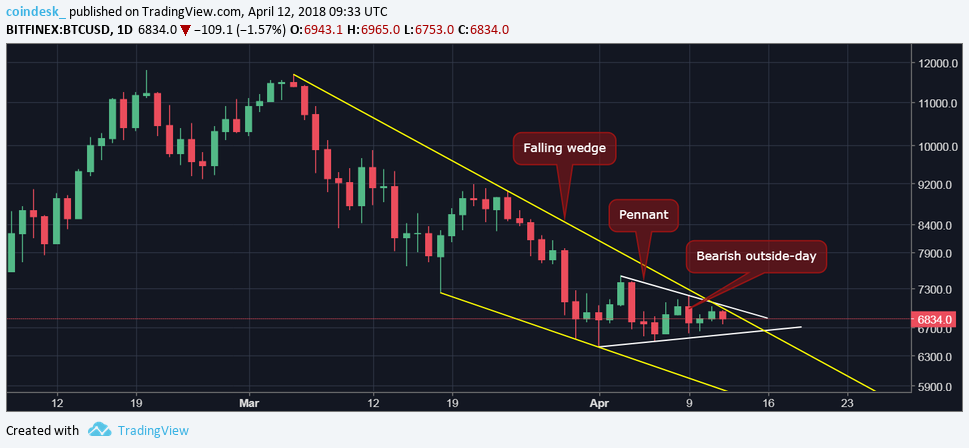
However, the price range continues to narrow on a daily basis (as seen on the chart below) and a breakout appears to be imminent.
Daily chart

The above chart (prices as per Bitfinex) shows:
Falling wedge, a bullish reversal pattern, meaning an upside break would confirm the tide has turned in favor of the bulls.
Pennant formation, a bearish continuation pattern, characterized by lower price highs and higher price lows. A downside break would indicate resumption of the sell-off from $9,050 (March 24 high).
So, there are conflicting patterns on the daily chart. That said, the failure on the part of the bears to capitalize on the recent bearish outside-day candle could be an indication of an impending rally.
BTC suffered a high volume drop from $7,189 to $6,611 on April 9 (bearish outside-day), engulfing the previous day's price action.
However, the follow-through in the next two trading days has not been encouraging for the bears, given that bitcoin moved back well above $6,611.
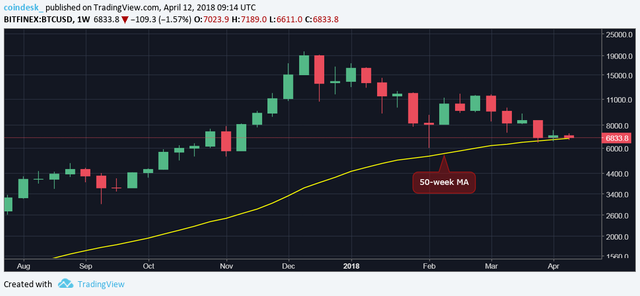
The bear's weakness, when viewed against the backdrop of the basing pattern along the ascending 50-week moving average (MA), suggests there is scope for a minor rally.
Weekly chart

The previous two weekly candles show bitcoin's dip below the rising (bullish) 50-week MA was short-lived.
As mentioned, BTC hit a low of $6,611 on April 9 and is now trading above the 50-week MA of $6,791. So, a base may have formed along the key moving average support.
The technical set-up also adds credence to historical evidence that bitcoin tends to put on a good show in April every year.
View
BTC will likely break through $7,100, confirming a falling wedge reversal (bull reversal) and move towards the resistance lined up at $7,510 (April 3 high) in the next 24 hours.
The odds of a bearish revival would rise if the cryptocurrency finds acceptance below $6,600. Such a move would signal downside break of the pennant pattern, thus opening the doors to $6,425.
Profitables Bitcoin Cloud Mining
How to buy Bitcoins
How to buy Litecoins
How to buy Ripple

CryptoTax.me Domain is now available for sale.
CryptoTokens.me Domain is now available for sale.
CryptoAdvisers.me Domain is now available for sale.
Great Domain for end users or investors, crypto!
Meaningful, Short and Memorable Domain!
Highly Brandable Crypto Domain
Rare memorable Crypto Domain

Hi! I am a robot. I just upvoted you! I found similar content that readers might be interested in:
https://www.coindesk.com/7-5k-bitcoin-price-charts-hint-at-bull-move-ahead/
Downvoting a post can decrease pending rewards and make it less visible. Common reasons:
Submit
This user is on the @buildawhale blacklist for one or more of the following reasons:
Downvoting a post can decrease pending rewards and make it less visible. Common reasons:
Submit