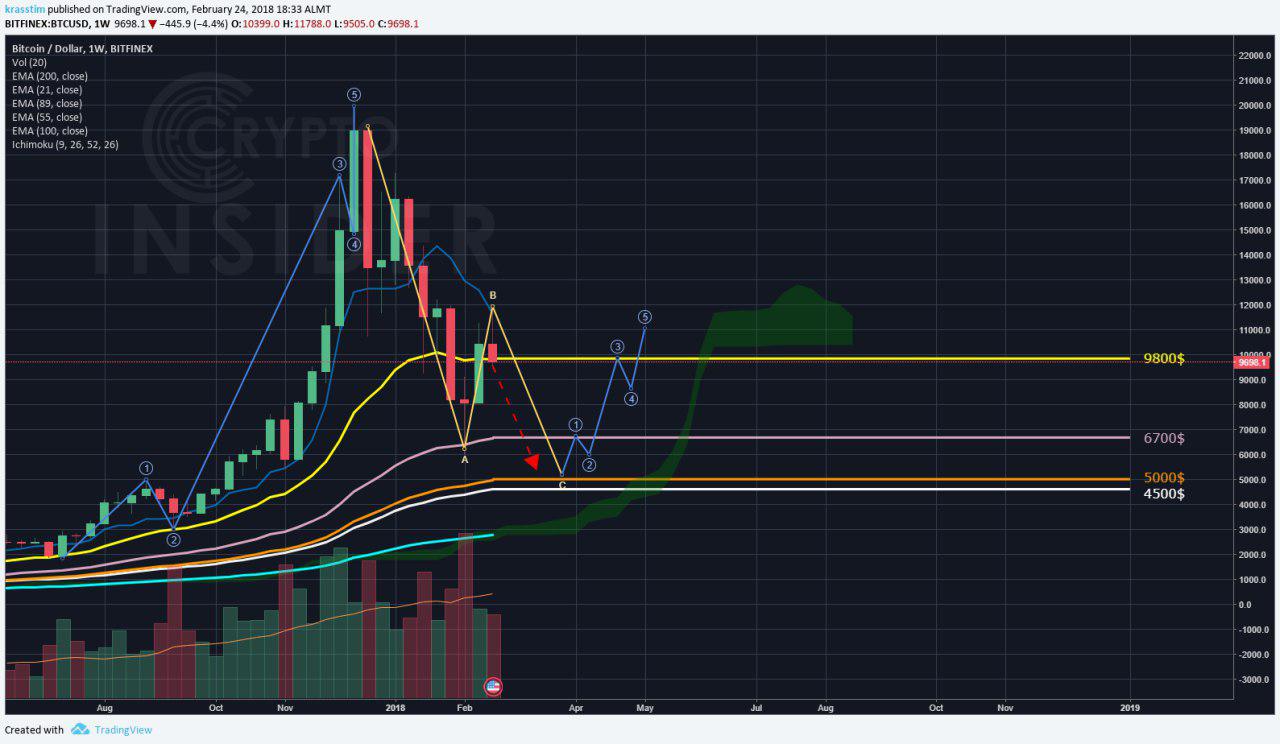
More detailed explanation of what was happened with BTC

- Yellow color line is a Kijun level. And breaking it by BTC meant the end of local uptrend. Afterwards BTC went down to 10200$.
- Then another crossing of Kijun line from bottom to up meant signal to sell BTC. If you remember I wrote you about checking your stoplosses or sell BTC.
- Next BTC went down to test EMA200, but it was bounced up from EMA200 to test Kijun line again.
- Kijun line reflected BTC before it even touched it.
- Another test of EMA200 by BTC and finally EMA200 was broken and BTC dropped down to lower border of Ichi cloud.
- And for now lower border of Ichi cloud keeps BTC from falling.
Alse we could observe on the chart that there was appeared some invisible support level (marked with white line).
As a result there was formed some kind of trading zone between 9800$-9600$. But it was also broken and BTC dropped below that support level which becomes now a resistance level. The way to zone 8800$-8600$ was opened for BTC, but I dont think that BTC will drop to there.
I suppose that BTC can go back to 9900$-10100$ on Monday and there will be short-term market flat with the following dropdown.
Hi! I am a robot. I just upvoted you! I found similar content that readers might be interested in:
https://medium.com/@cc_insider/more-detailed-explanation-of-what-was-happened-with-btc-e953f5fe9a9d
Downvoting a post can decrease pending rewards and make it less visible. Common reasons:
Submit
Hi @cryptosniper
Excellent article. I subscribed to your blog. I will follow your news.
I will be grateful if you subscribe to my blog @user2627
Good luck to you!
Downvoting a post can decrease pending rewards and make it less visible. Common reasons:
Submit