Watch Video On DLive
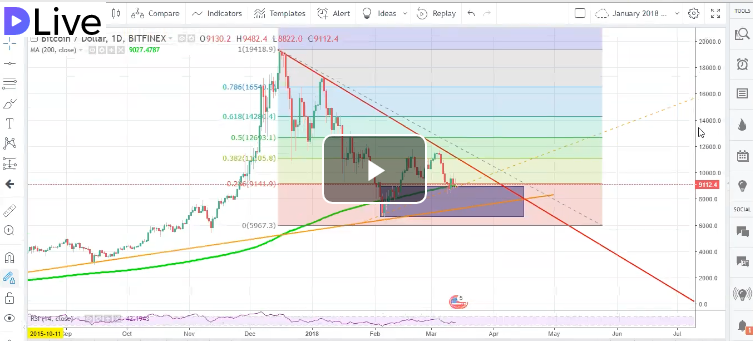
I haven't done any crypto videos lately, so I thought I would just do a general overview of some of the long term trends I am seeing. I discuss the recent downtrend due to a Mt. Gox sell off combined with an over hyped market of new investors. I also outline some trend lines, do a Fibonacci entrancement analysis, and go over the 200 day moving average & Mayer multiple. This recent down trend was the first time we have broken the 200DMA for over 2.3years! This could either be a sign of a great buying opportunity or the beginning of a serious bear market.
I originally attempted to upload this video to DTube, but the video was having issues loading. I could not get the IPFS file to download, so I wasn't able to help seed the video manually either. I have cross posted to YouTube now, and I just attempted my first DLive upload. The upload process with DLive was smooth on my end, so hopefully there won't be any issues playing the video for you.
I am not a financial adviser. Nothing in this article or video should be mistaken as financial advise. I am simply a crypto enthusiast talking about theoretical possibilities that I see based on my opinion of random lines on charts.
good post
Downvoting a post can decrease pending rewards and make it less visible. Common reasons:
Submit