For education.
Price (holding, weakening)
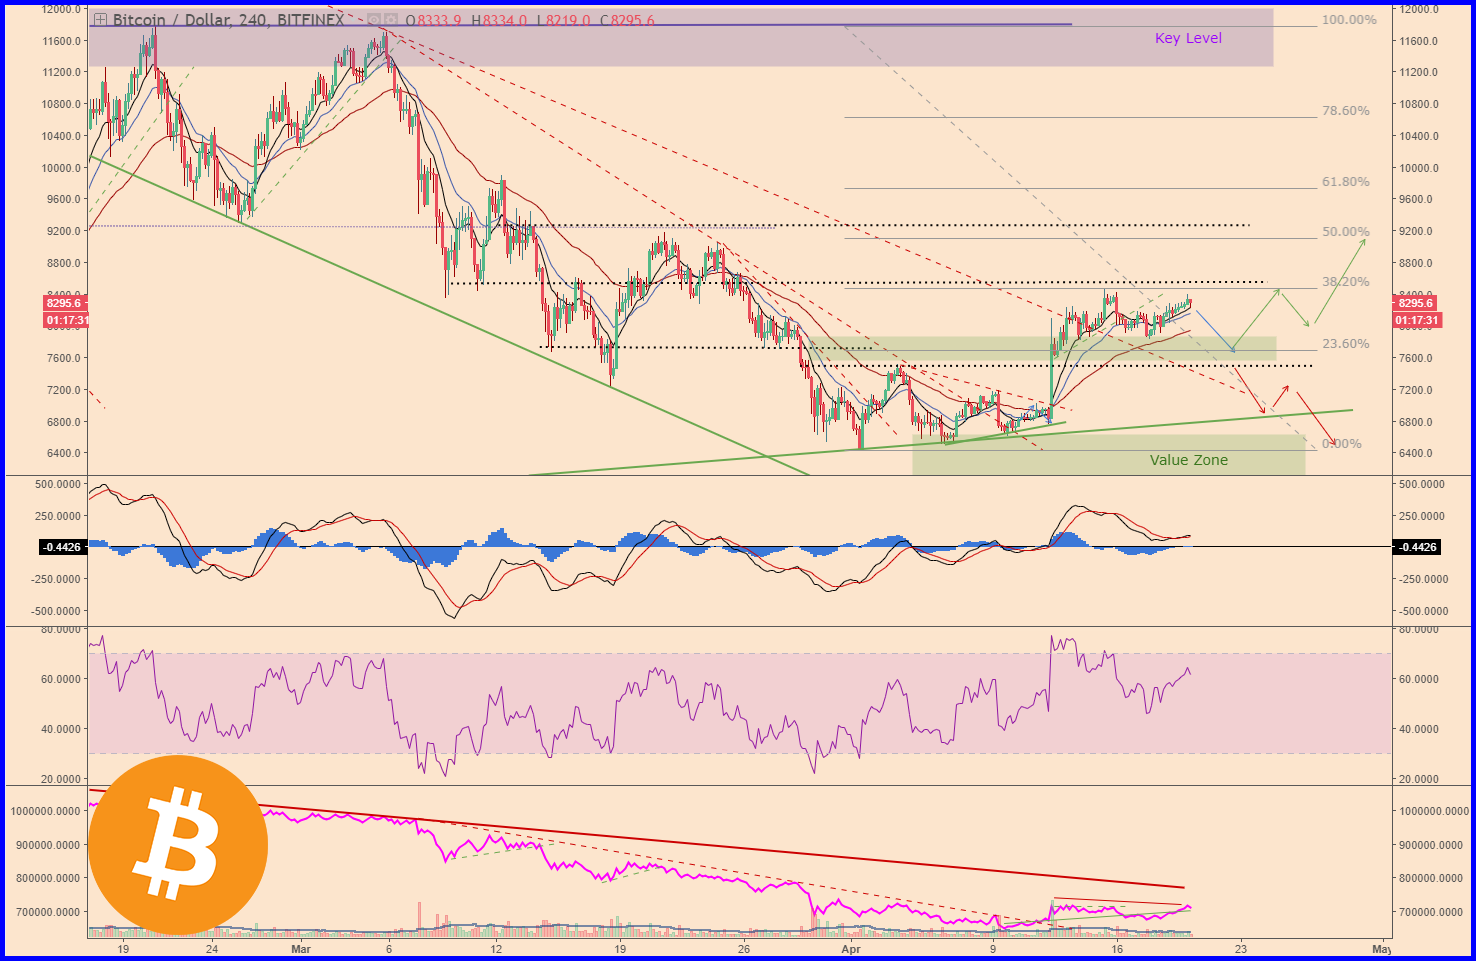
Following on from yesterday's review (here), the BTC price has maintained a slow and steady short term uptrend from $7,800 to $8,400.

The price is now approaching the previous area of resistance at about $8,450 and the next few candles (1-2 days) will determine whether the price makes a new higher high or fails again at this level.
Indicator Check (mild bearish divergence)
The MACD and RSI indicators are suggesting mild downward pressure, whist the price is in a sideways trend. This suggests some weakening, although it is not a strong signal.
Volume (low, flat)
The average trading volume on Bitfinex is getting low again, whilst the On-Balance-Volume (OBV) indicator doesn't indicate strength on either the buyer or seller side.
Trading Strategy (pullback, consolidation, long)
We're still awaiting a pull back into the short term value zone, to look for a long term entry. If the price breaks above the $8, 500, the pull back might not come and we may need to switch to a breakout strategy.
If the price fails at the $8,450 level, we're looking for a pull back (spike down) to about $7,600 where a brief consolidation pattern forms and then breaks to the long side.
Until tomorrow,
Bobby
(Trader)