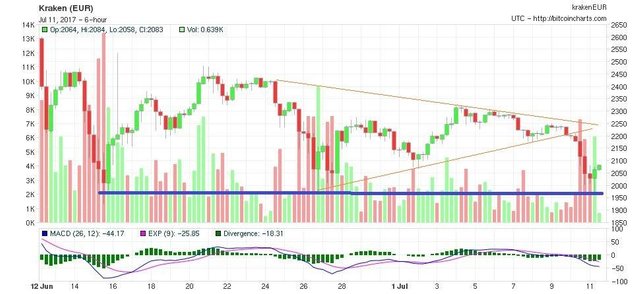
BTC has been trading in a triangle pattern (in orange on the chart) for some time now. Yesterday the pattern broke to the downside. BTC fell to the next support zone that is around 1950€. Currently that support is holding but should that one break we may have a dip all the way to the next support zone around 1750€.
As I explained in last week's post we have seen this kind of corrections already in January and March and I mentioned that this one was probably not over as this one seemed a bit mild compared to the large increase in price experienced in April and May. I expect prices to eventually head back up if the 1975€ support is not broken.
Authors get paid when people like you upvote their post.
If you enjoyed what you read here, create your account today and start earning FREE STEEM!
If you enjoyed what you read here, create your account today and start earning FREE STEEM!
I like your levels and expectations. This is also the 4th (4th 1/2) attempt lower, and when markets are persistent, it's wise to listen.
I did a similar piece a few hours ago on the "broad market" that may interest you. https://steemit.com/trading/@cryptographic/crypto-in-freefall
Thanks.
Downvoting a post can decrease pending rewards and make it less visible. Common reasons:
Submit
thanks for sharing!
Downvoting a post can decrease pending rewards and make it less visible. Common reasons:
Submit
@erlik got you a $0.18 @minnowbooster upgoat, nice! (Image: pixabay.com)
Want a boost? Click here to read more!
Downvoting a post can decrease pending rewards and make it less visible. Common reasons:
Submit
This post received a 4.3% upvote from @randowhale thanks to @erlik! For more information, click here!
Downvoting a post can decrease pending rewards and make it less visible. Common reasons:
Submit
This post has received a 0.21 % upvote from @booster thanks to: @erlik.
Downvoting a post can decrease pending rewards and make it less visible. Common reasons:
Submit