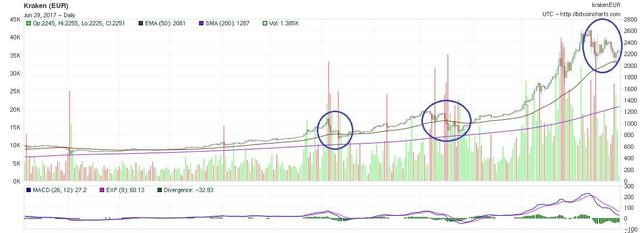
Bitcoin just recovered from a correction. Since these event tends to scare people off I though it would be beneficial to take some distance, so I had a look at the 1 year BTC/EUR chart. You will notice that the pair has been in several such corrections during the last year, one in January and one in March. In both cases after a significant fall Bitcoin always recovered to an higher value.
I also plotted the 50 days exponential moving average (in brown) and you will notice that in the case of both those correction the price went under for at least a week, which we have not yet experienced this time, so there is a risk of one more down leg to this correction. When looking at the 200 days simple moving average (in purple) we see a clear uptrend that has never been breached in the last year, but the price is currently very far from the average which mean we may have a cooling down period at some point to let it catch up.
Overall the long term trend is still up, but we may need a bit of patience.
Authors get paid when people like you upvote their post.
If you enjoyed what you read here, create your account today and start earning FREE STEEM!
If you enjoyed what you read here, create your account today and start earning FREE STEEM!