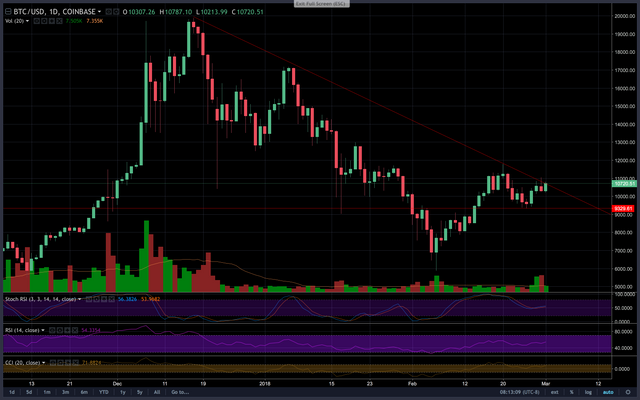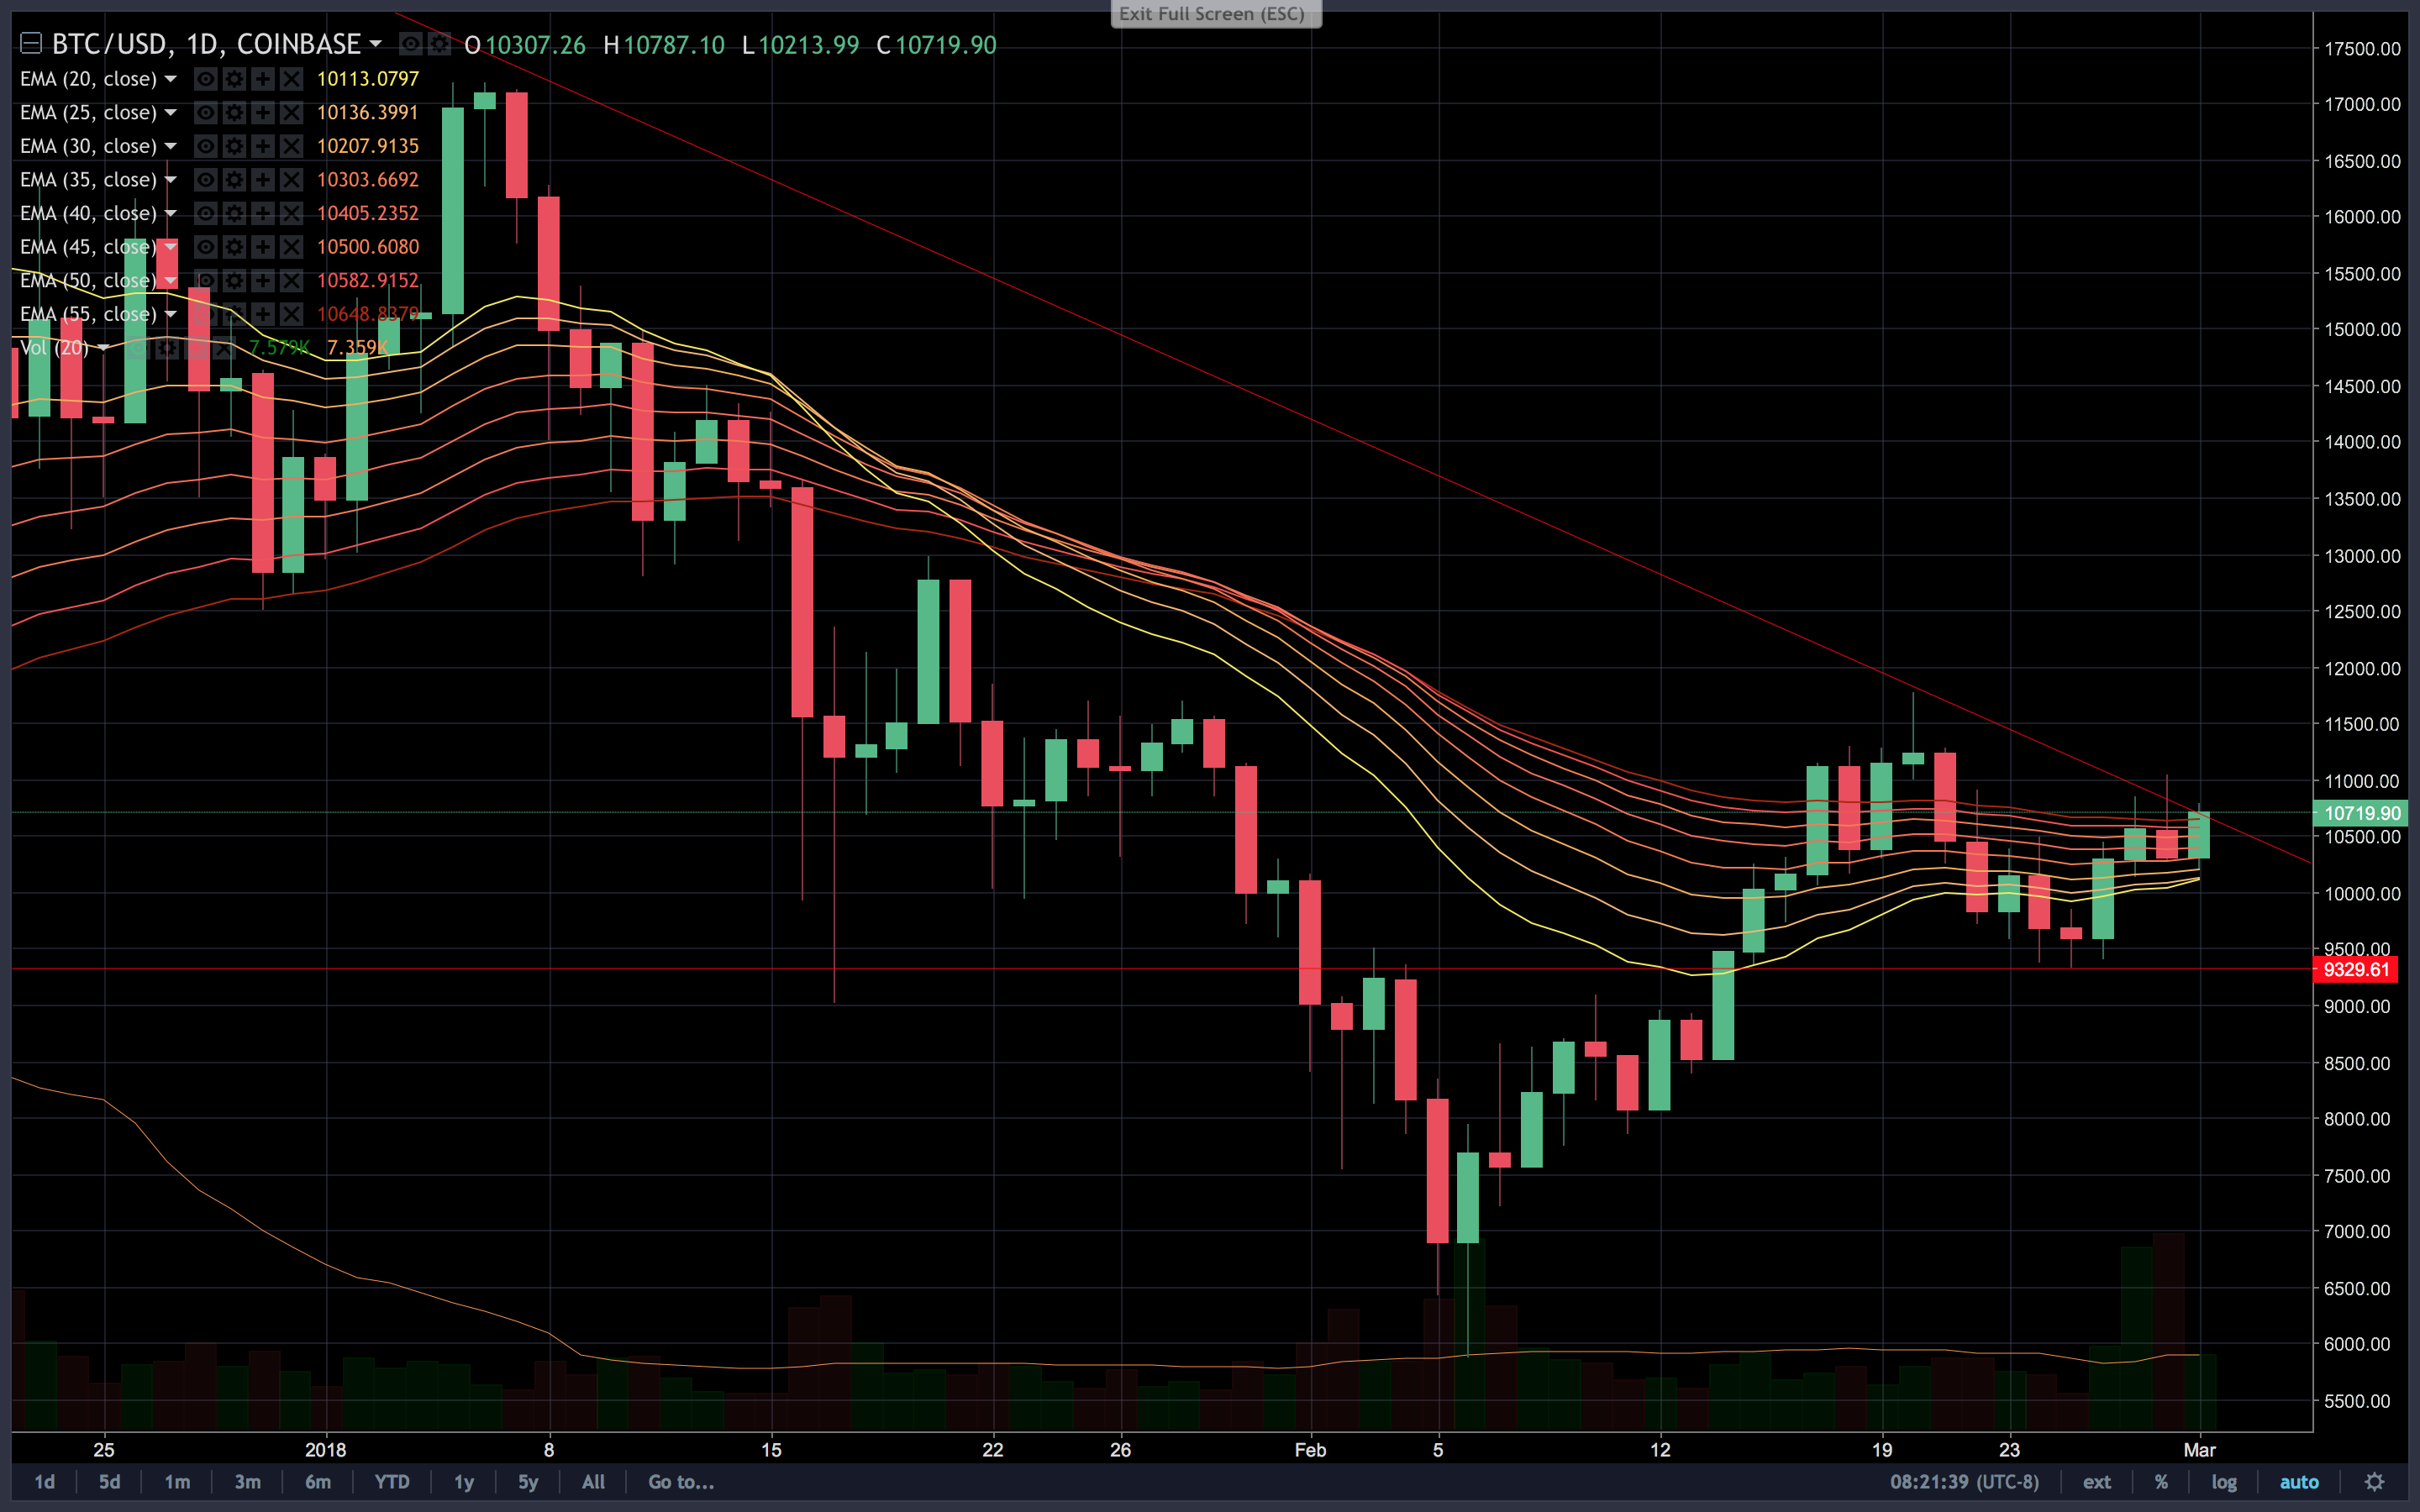
Bitcoin has tested and tested the resistance trend line. Yesterday, we saw the biggest bearish candle bar for volume that we've seen in over two months. The good news is that we maintained a higher low over the previous day. The order book seems to be pretty solid at the level.
Daily technical indicators are still bullish, so the path of least resistance is to the upside in the shorter term.

The EMA's are looking strong too as BTC's price is back in price level range and is trying to get a close above resistance. The recent trend saw price support inside the EMA band, so this is an additional sign for upside movements.

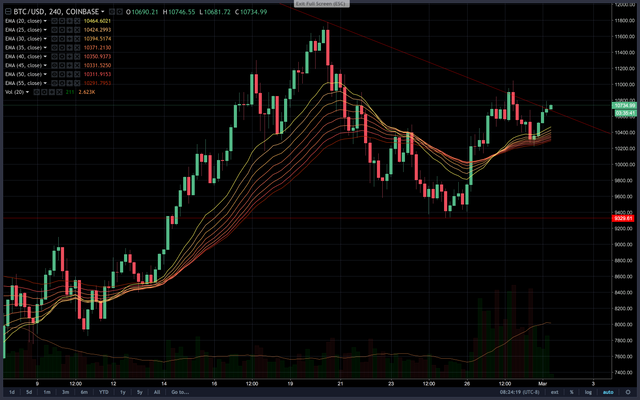
On the 4-hr chart, prices bounced off of EMA support and now are showing strong signs of rally movement.
If this momentum maintains, we are looking at an upcoming healthy rally!

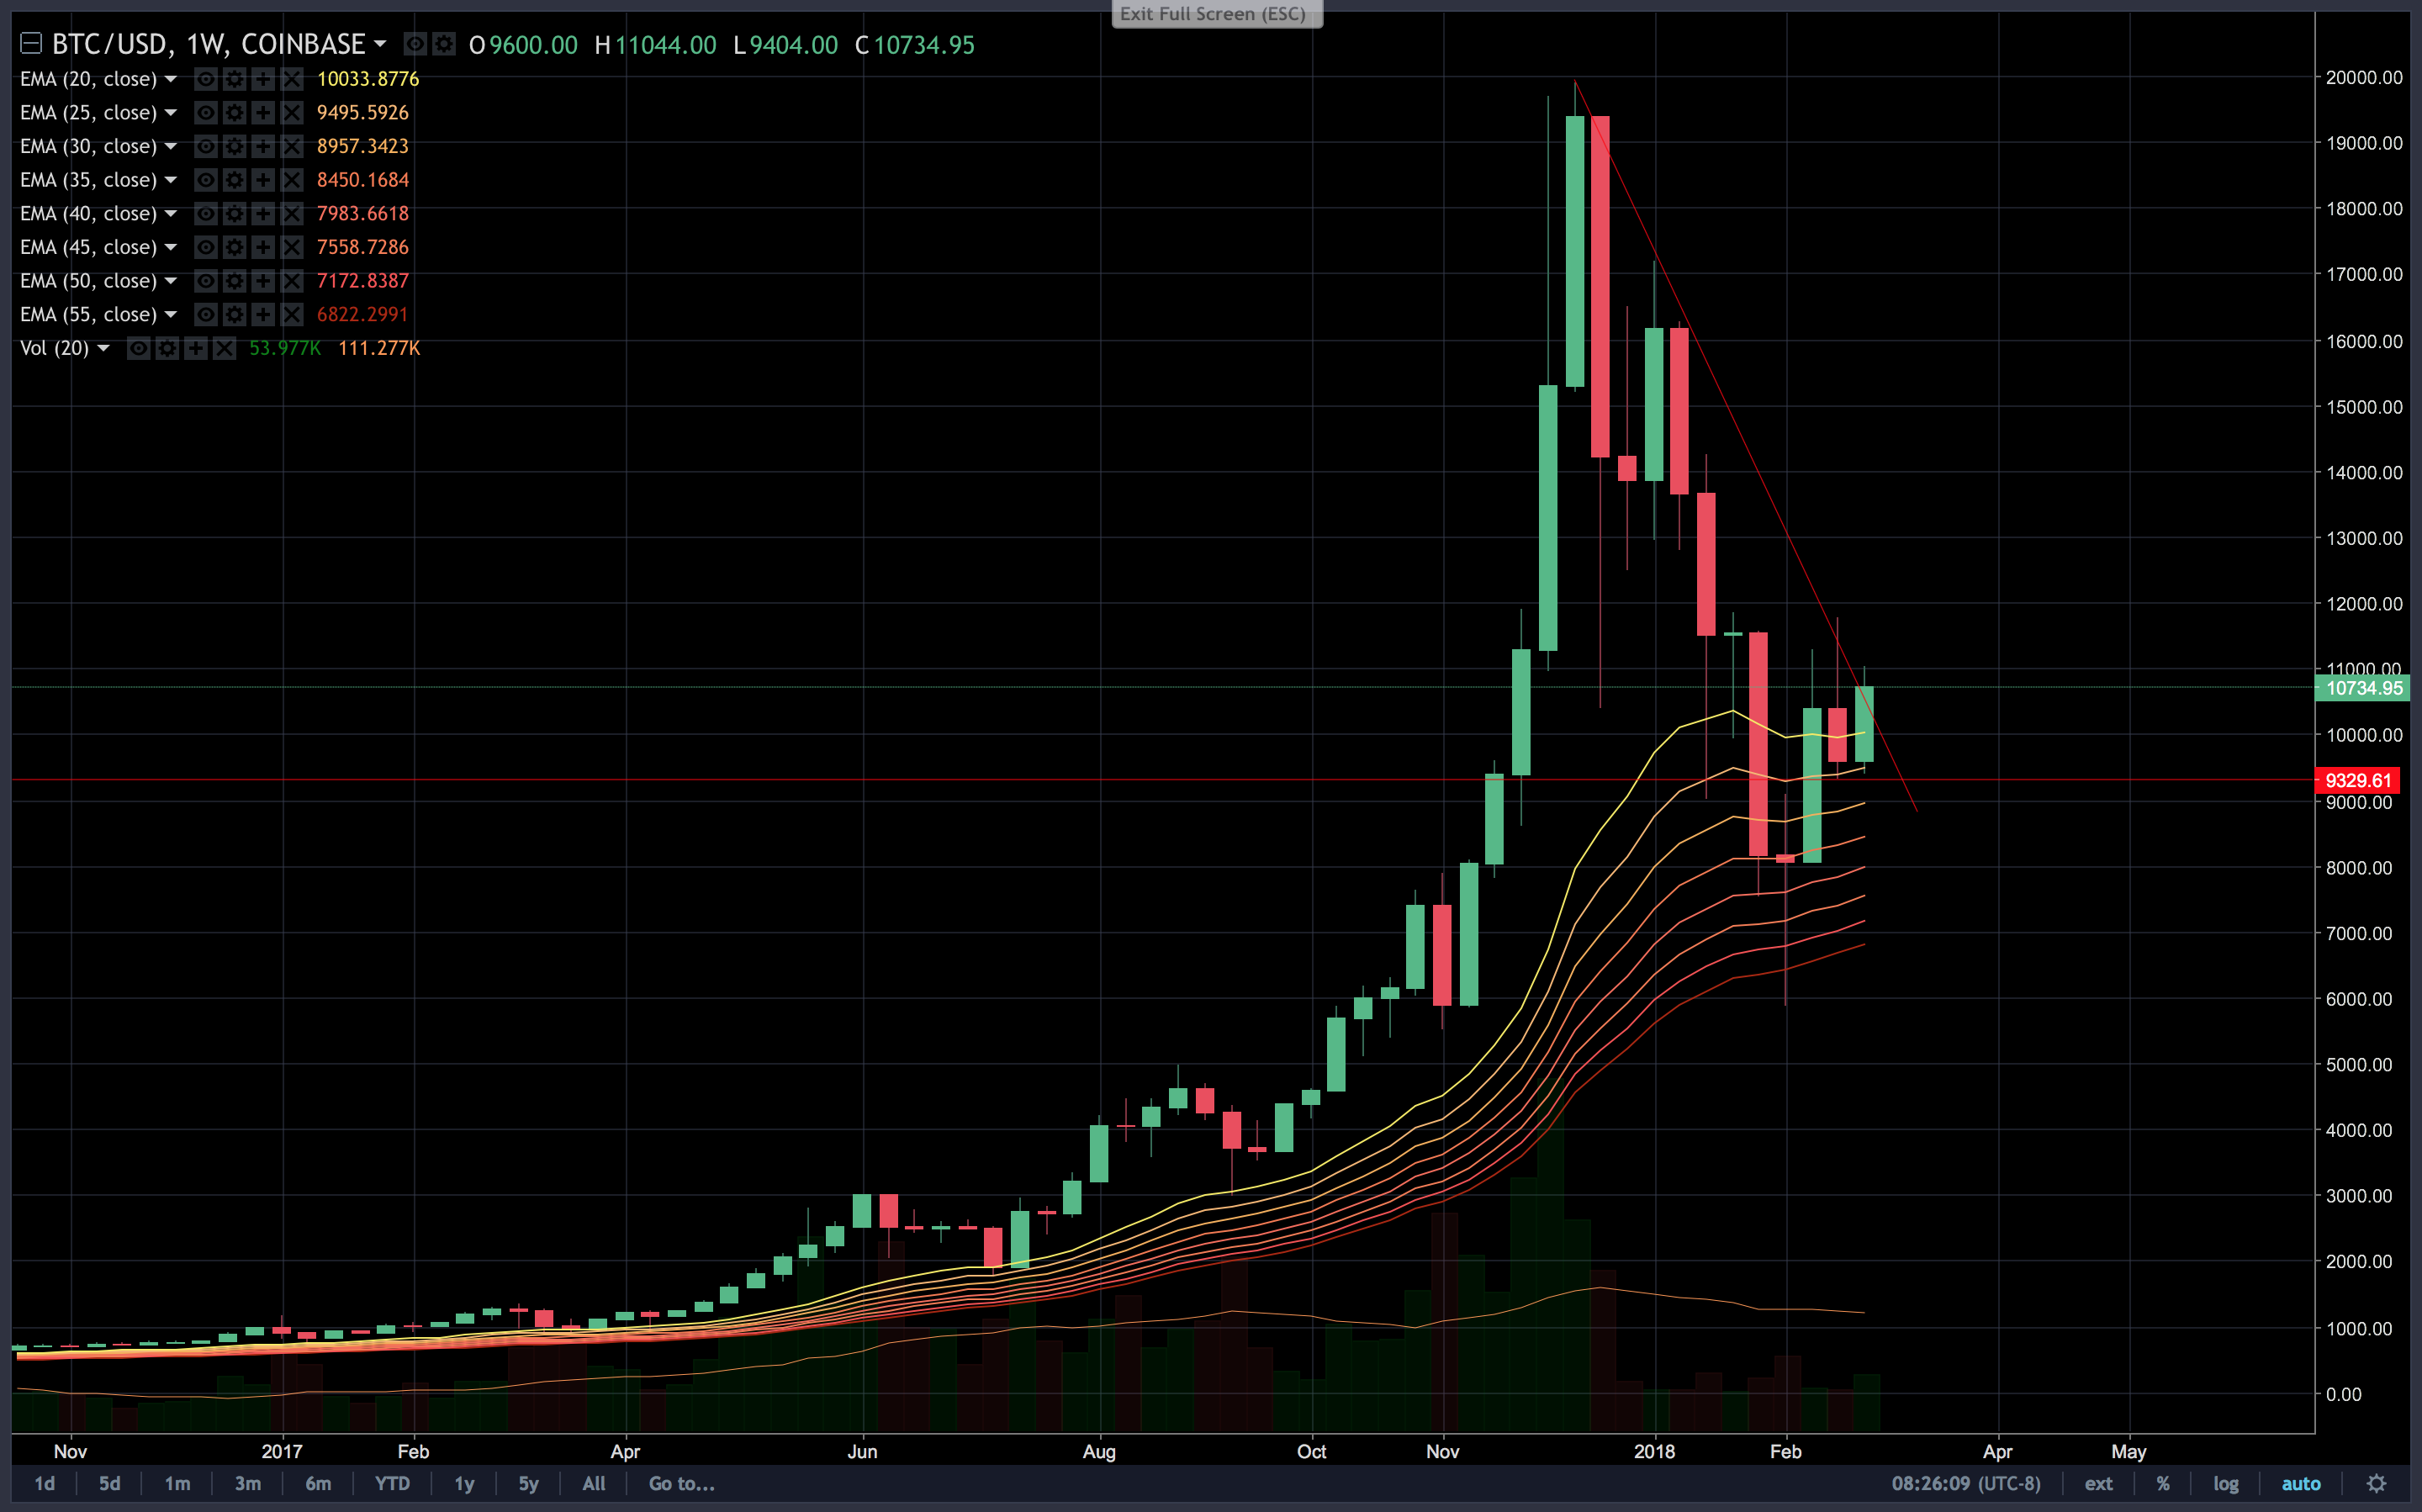
The weekly shows the same action that prices have bounced off of EMA support. The recent huge pullback was completely normal for an uptrend due to the parabolic growth.
Nice post.
Downvoting a post can decrease pending rewards and make it less visible. Common reasons:
Submit
Other Bitcoin investments benefit from the difference in market prices determined by the amount of capital is very high, but steam investment is no risk if the price is low.
Downvoting a post can decrease pending rewards and make it less visible. Common reasons:
Submit
Follow and vote back
Downvoting a post can decrease pending rewards and make it less visible. Common reasons:
Submit